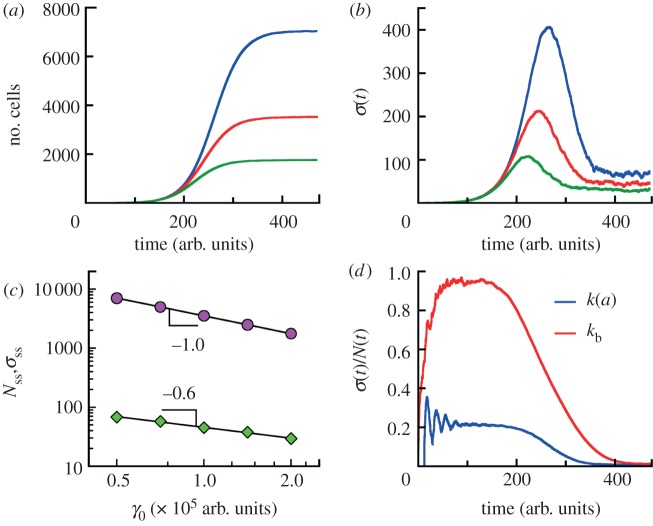
Figure 7.
Competitive growth. (a) The average numbers of cells as functions of time for competitive populations with age-dependent cell division rate k(a) (distribution II, see caption to figure 1d) and death rates proportional to the number of other individuals γ = γ0(n − 1). The populations are grown from a single cell of the zero age a = 0. The numbers of cells reach the steady state Nss at long times. The data for each γ0 are obtained from simulations for 120 growth trajectories. (b) The standard deviations σ(t) of the mean sizes of competitive populations from data in (a) are non-monotonic functions of time. At long times, σ(t) approach the limiting values σss in contrast to exponentially growing populations. The population size distributions at steady state are stationary Gaussian around mean sizes Nss (see the electronic supplementary material, figure S9 of SI). (c) The average numbers of cell Nss (circles) and its standard deviations σss (diamonds) at steady state are shown as a function of ‘competitive’ cell death rate γ0. The data are analysed in the time interval from t = 400 arb. units to t = 474 arb. units for all values of γ0. The mean population is inversely proportional to γ0. (d) Comparison of the population fluctuation for age-dependent (blue) and age-independent (constant division rate kb) (red) models. γ0 for these models are identical. Parameters are chosen so that the average growth rates in the absence of cell death are identical. The age-dependent model shows a significantly different behaviour.

