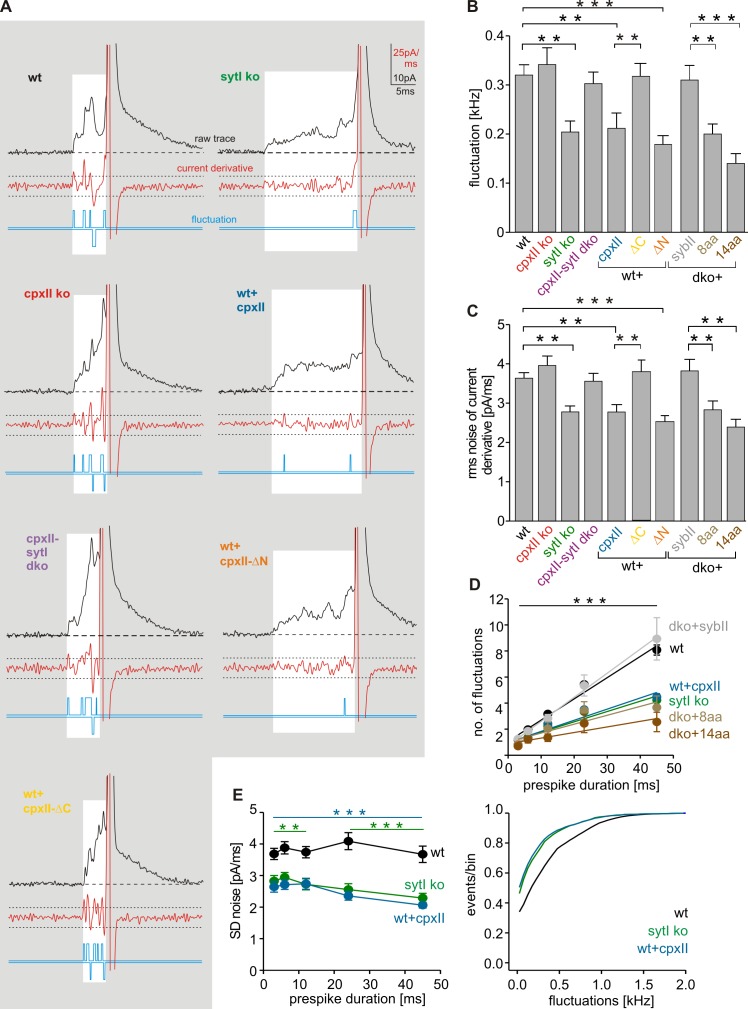
Figure 7.
CpxII controls the fusion pore jitter. (A) Exemplary analyses of current fluctuations during the prespike phase (highlighted area). Deflections of the current derivative (red traces) beyond the threshold (dashed lines = ±4 SD of baseline noise) were counted as fluctuations (blue traces). The displayed events have a similar charge and 50–90% rise time (wt: 348 fC and 160 µs; SytI ko: 303 fC and 160 µs; CpxII ko: 323 fC and 200 µs; CpxII-SytI dko: 312 fC and 200 µs; wt + CpxII: 334 fC and 160 µs; wt + CpxII-ΔC: 307 fC and 160 µs; wt + CpxII-ΔN: 335 fC and 200 µs), indicating that differences in fluctuations are not a consequence of diffusional smearing. (B) Mean fluctuation frequency (positive and negative fluctuations) of the prespike signal for the indicated ko cells, wt cells expressing CpxII, or its mutant variants and v-SNARE dko cells expressing SybII or a linker mutant. Data for SybII and its mutants carrying an extended juxtamembrane domain (plus 8 or 14 aa: dko + SybII-8aa and dko + SybII-14aa) are taken from Kesavan et al. (2007). Data were averaged from the number of cells indicated in Figs. 6 C and 5 H. (C) rms noise of the current derivative during the prespike. (D) Number of fluctuations increases with longer prespike duration and is significantly reduced over the entire range of prespike durations in SytI ko, wt + CpxII, and v-SNARE dko cells expressing the SybII linker mutants. (E) rms noise plotted as a function of prespike duration (left) and fluctuation frequency as cumulative frequency distribution (right). Data were collected from the following number of cells (prespike signals): wt, 41 (3,503); SytI ko, 22 (1,626); and wt + CpxII, 21 (815). **, P < 0.01; ***, P < 0.001, Student’s t test versus control at the corresponding prespike duration in D and E. **, P < 0.01; ***, P < 0.001, in B and C. Error bars indicate means ± SEM.

