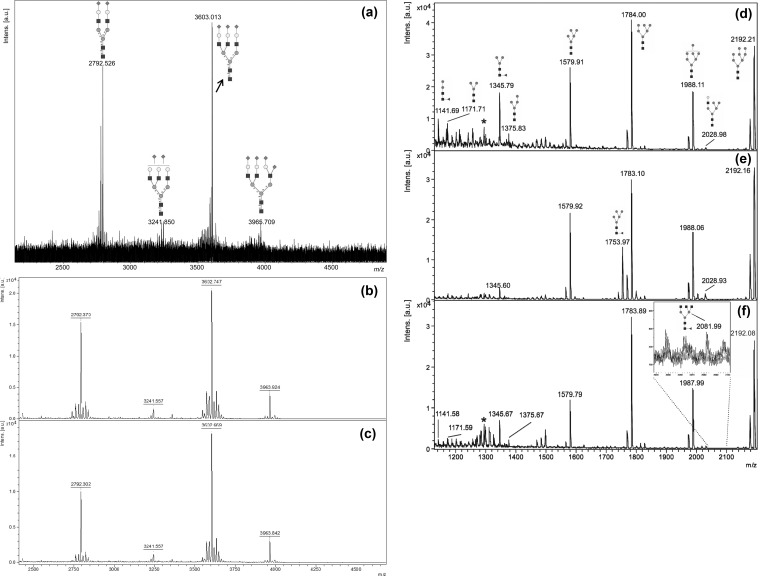
Figure 2.
(a–c) Positive-mode MALDI mass spectra of permethylated FANGS-released N-glycans from 2.5 μg fetuin: (a) 1/10th of the N-glycan sample loaded onto the MALDI plate for analysis by FT-ICR and (b,c) 1/20th of the N-glycan sample loaded onto the MALDI plate for analysis by TOF-MS. (d–f) MALDI-TOF mass spectra of permethylated FANGS-released N-glycans from (d) WT HeLa cells, (e) HeLa cells treated with 10 μg/mL swainsonine, and (f) COG4KD cells. Each spectrum is derived from cells collected off one confluent 10 cm dish, approximately 2 to 3 × 10⁶ cells. Peaks derived from contaminating cellulose oligomers are indicated with *. N-Glycan structures are denoted following the conventional symbols described in ref (36). Peak intensities in each spectrum are normalized to the most intense signal in the spectrum.

