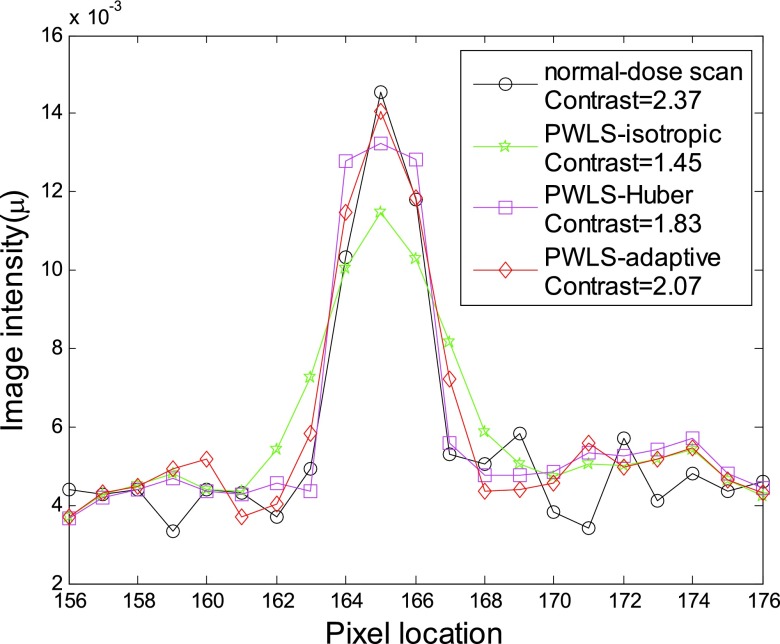
Figure 10.
Comparison of the profiles along the vertical line labeled in Fig. 7b between the three SIR algorithms with simulated low-dose sinogram and the FBP reconstruction with the normal-dose sinogram. The contrast of the small object and the corresponding algorithms are illustrated in figure legend.

