
Figure 2.
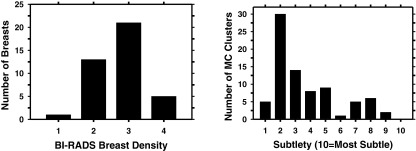
Characteristics of our data set. Left: distribution of breast density in terms of BI-RADS category estimated by a MQSA radiologist. Right: distribution of the subtlety ratings of the MC clusters in DBT volume judged by the same radiologist. The subtlety rating was estimated for the CC and MLO views of each cluster independently.