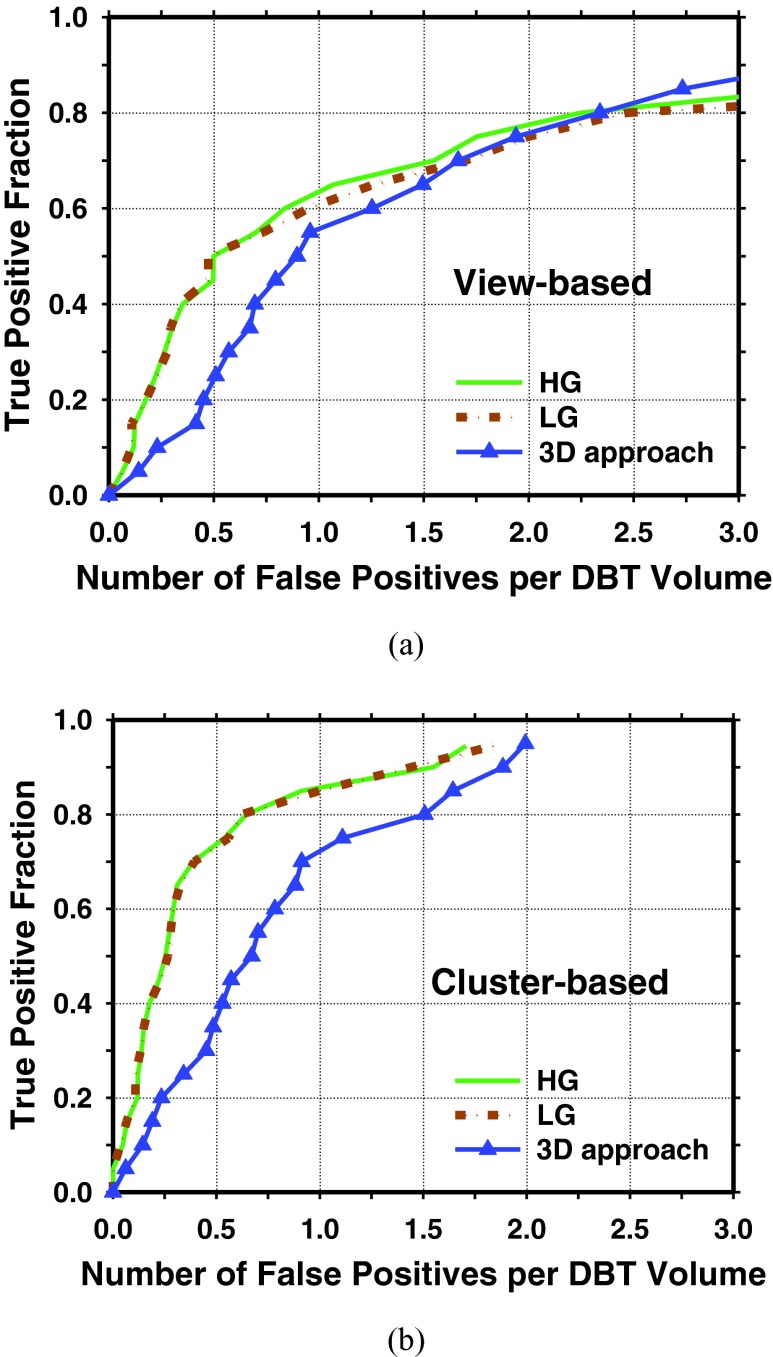
Figure 8.
FROC curves for detection of clustered MCs in DBT volumes with our previously developed prototype CADe system using a 3D approach (Ref. 10). For the HG and LG basis functions, the average curves were derived from the curves for the two test subsets by averaging the FPs rates at the corresponding sensitivity level. For the 3D approach, the FROC curve was obtained directly from the entire data set. (a) View-based FROC curves; (b) cluster-based FROC curves.

