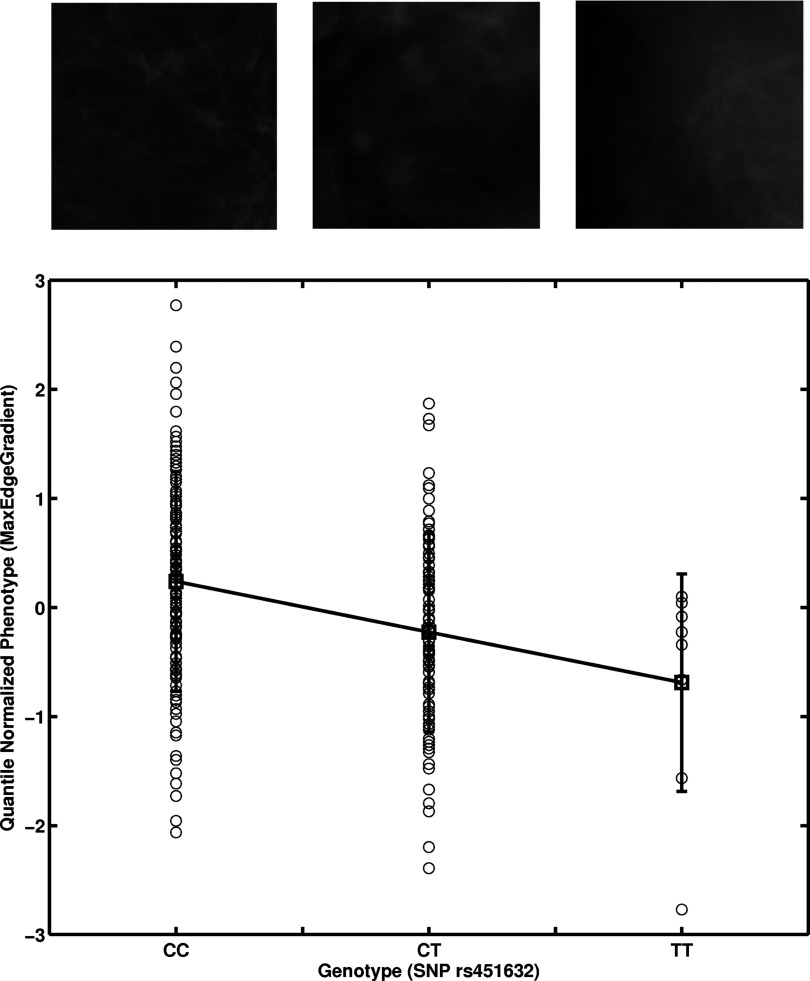
Figure 4.
Linear regression of the image-based phenotype MaxEdgeGradient on a genotype SNP position at 69630002 (rs451632) in chromosome 4 resulting in an adjusted p-value of 0.022. (See Table 1.) Selected image examples from each genotype are shown.

