Figure 6.
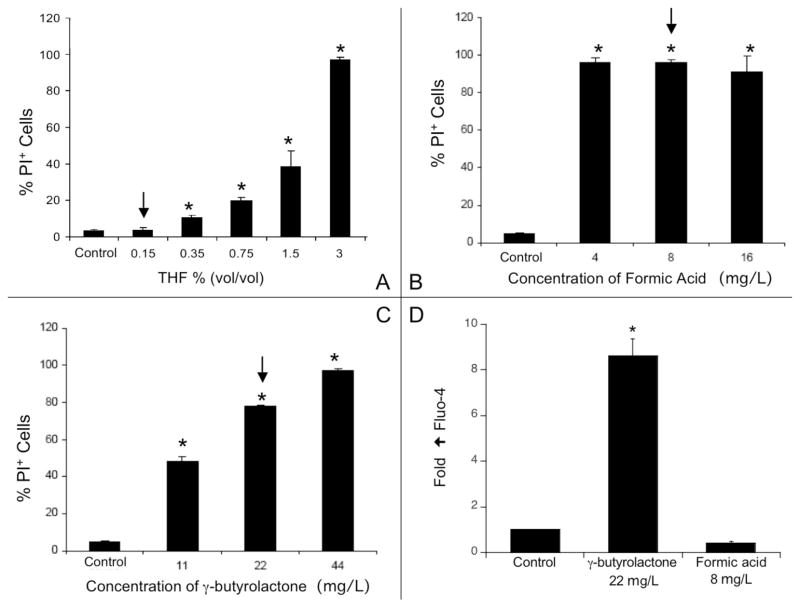
(A) Toxicity (PI) of a pure THF solution towards RAW 264.7 cells. The arrow indicates a concentration in THF ~15 times larger than the total organic carbon concentration of the THF/nC60 stock suspension. (B) Toxicity (PI) of formic acid and (C) γ-butyrolactone. The arrows indicate the concentration measured in the THF/nC60 stock suspension. (D) Effects of formic acid and γ-butyrolactone on intracellular [Ca2+]i calcium levels. *: p<0.05.

