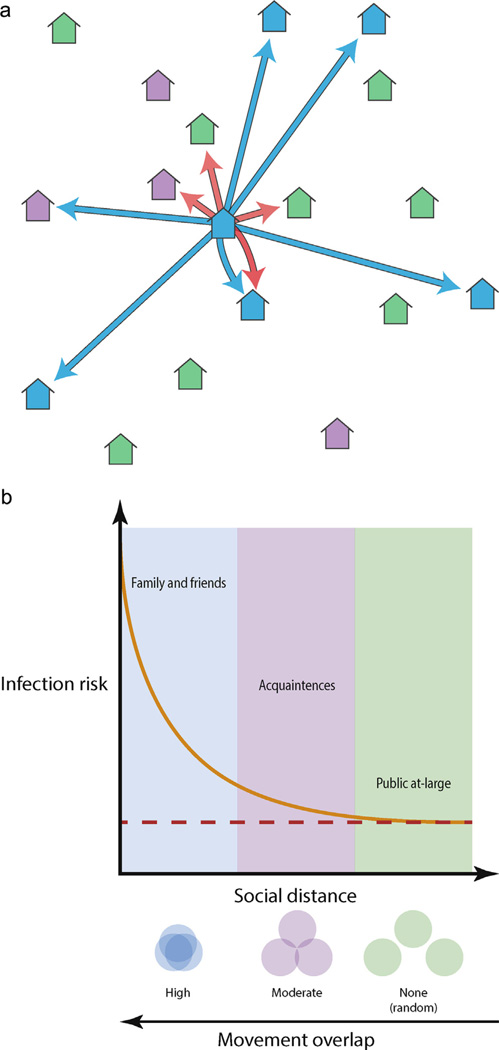
Fig. 1.
The social proximity hypothesis. (a) As an illustration, we place 18 houses into 3 social groups: members of the same social group as the central home (blue houses), homes of acquaintances (i.e. infrequently visited homes, purple houses) and houses not visited by members of the central home (green houses). Blue arrows indicate houses visited in a given time interval by residents of the central home. Red arrows indicate houses within the dispersal range of mosquitoes living within the central home. (b) Given a household with an infectious individual mosquito, the people at greatest risk of infection there are family and friends (i.e., same social group). People more socially distant from the household, i.e., acquaintances, are less likely to visited the infested house and so their risk of infection is smaller. Thus, as social distance between people increases, the probability they will overlap somewhere mosquitoes are present diminishes. This reduces the risk of infection until it equals the risk due entirely to an infectious mosquito traversing the distance between the two houses (dashed red line).

