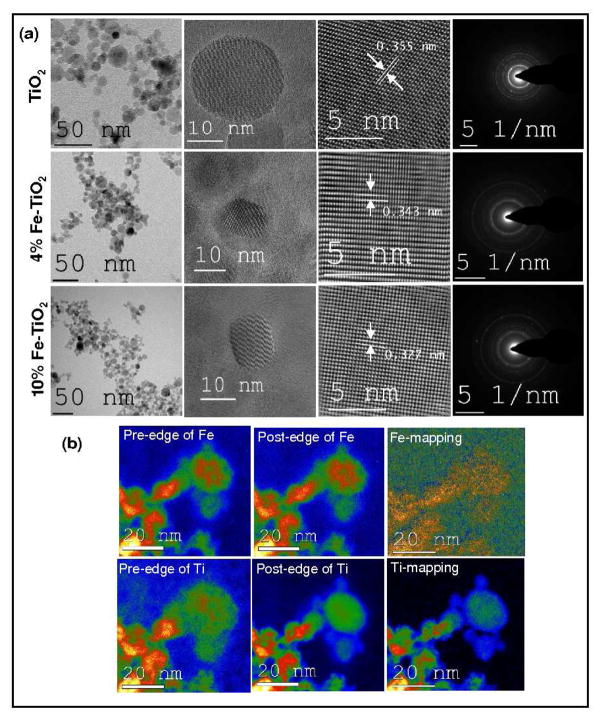
Figure 1.
Microscopic imaging of undoped and Fe doped TiO2 nanoparticles. (a): Low resolution, high resolution imaging of single particles, magnified portion of the particle and respective SAED patterns of; Undoped TiO2 (upper panel); 4 at wt % Fe doped TiO2 (middle panel) and; 10 at wt % Fe doped TiO2 nanoparticles (Lower panel).
(b) The Energy filtered transmission electron microscopic images of 10 at wt % Fe doped TiO2 nanoparticles. The pre and post edge along with elemental mapping (Fe and Ti) clearly show that Fe is homogeneously distributed in the TiO2 matrix.

