Figure 4.
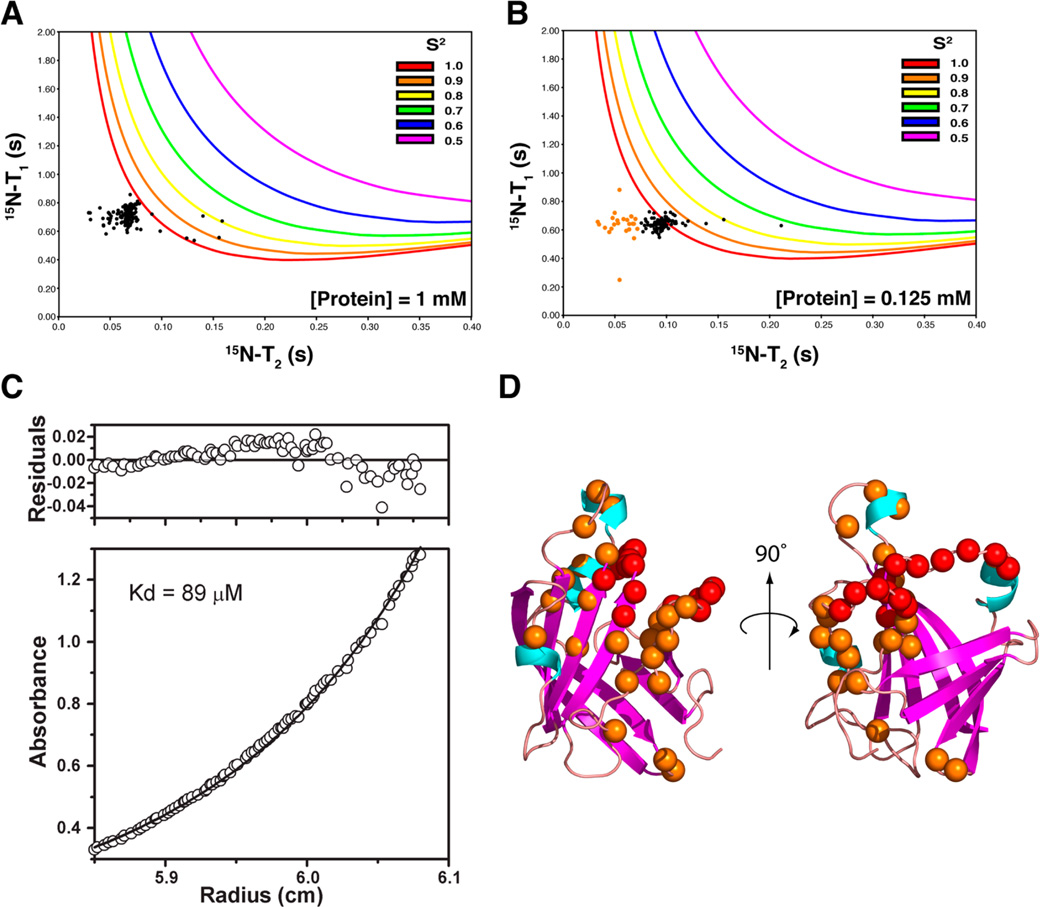
Dynamics and ultracentrifugation analysis. (A) Plot of experimentally determined T2 vs T1 data (black dots) for 1 mM BaSrtCΔ55 (assignable backbone 15N resonances). Also plotted are lines that correspond to calculated T2 and T1 values for various S2 order parameter values and correlation times (correlation times increase along each line in a clockwise fashion). (B) Same as panel A, but T2 and T1 data were collected at a protein concentration of 0.125 mM. Residues with T2 times of <0.07 s are colored orange. (C) Analytical ultracentrifugation equilibrium data demonstrating that BaSrtC is a dimer with a KD of 89 µM. (D) Structure of BaSrtC with unassigned residue backbone nitrogens colored red. Residue backbone nitrogens with short T2 times identified in panel B are colored orange.

