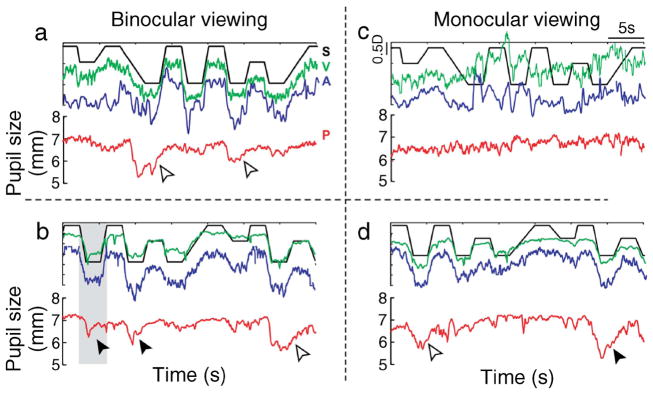
Figure 2.

Raw stimulus (S), accommodation (A), vergence (V) and pupil (P) traces plotted as a function of time for a representative 5.6-month-old infant (panels a and c) and 26.2-yr-old adult (panels b and d) under binocular (panels a and b) and monocular (panels c and d) viewing conditions in Experiment I. The stimulus, accommodation and vergence traces are shifted vertically for clarity (scaling shown in top right panel). The horizontal relationship between these three traces is not altered. Pupil traces are plotted on an absolute scale. The gray box in the bottom left panel shows a representative epoch used for calculating the correlation between gaze and stimulus position.
