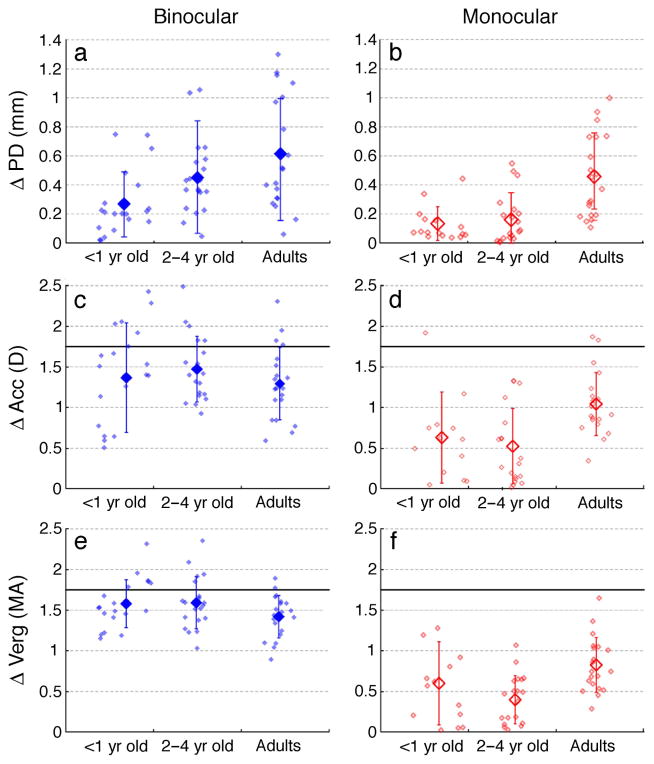
Figure 4.
Δpd (panels a and b), ΔAcc (panels c and d) and ΔVerg (panels e and f) for each age group under binocular (left panels) and monocular (right panels) viewing conditions in Experiment I. The small diamonds in all panels show data from individual subjects and the big diamonds represent the mean data. Error bars show ±1 SD. The horizontal spread in the small diamonds in each panel indicate that subjects of different ages were present within a given age group. The big diamonds represent the average data of all these ages within a given group. The mean pupil, accommodative and vergence responses to the ramp stimuli were larger under binocular than under monocular conditions, albeit with large inter-subject variability. The monocular pupil, accommodative and vergence responses of adults were also larger than those of infants and children.

