Figure 5.
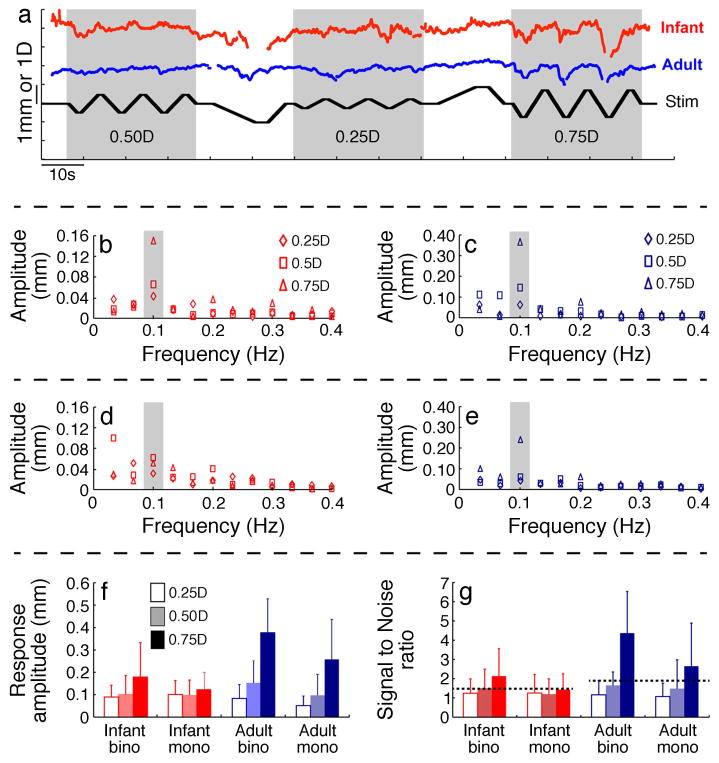
Panel a: Representative raw traces of pupil responses of an infant and adult to the quasi-sinusoidal stimulus used in Experiment II plotted as a function of time under binocular viewing conditions. The stimulus and pupil response traces are shifted vertically for clarity (scaling shown in top right panel). The horizontal relationship between the traces is not altered. Panels b–e: Amplitude spectra of infant (panels b and d) and adult (panels c and e) pupil responses under binocular (panels b and c) and monocular (panels d and e) viewing conditions. In panels b–e, the pupil responses from individual subjects were pooled together and the Fourier transform of the pooled data is shown to demonstrate the overall trend. The gray bars in panels b–e highlight the response amplitude to the 0.1 Hz stimulus frequency. Note that the ordinate scales of panels c and e are different than those of panels b and d. Panel f: Mean (±1 SD) binocular and monocular pupillary response amplitude at 0.1 Hz. Panel g: Mean (±1 SD) binocular and monocular SNR’s of infants and adults at 0.1 Hz. The dashed lines indicate the threshold SNR calculated when the target was stationary. The pupils of 3–4 month-olds responded significantly to a 0.75 D quasi-sinusoidal stimulus under binocular conditions, but not under monocular conditions. Adult pupils responded to the 0.75 D sinusoidal stimulus under both viewing conditions.

