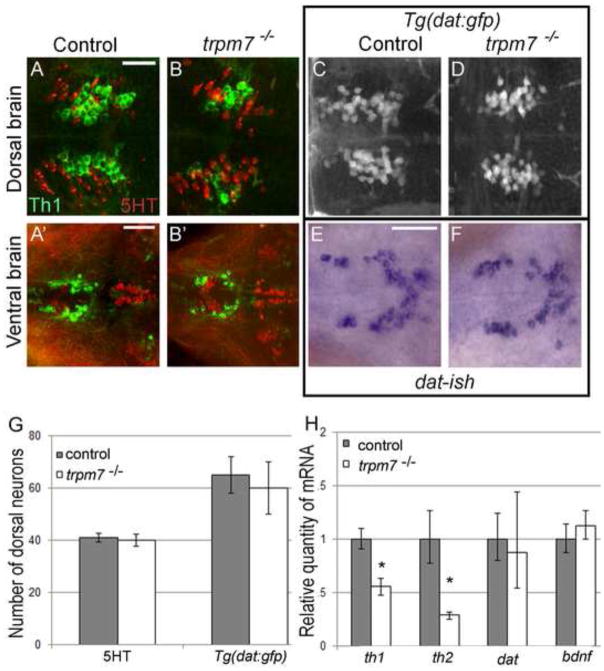
Figure 5. Numbers of serotonergic neurons and neurons expressing dat are normal in trpm7 mutants A,B; A.
′,B′)
Dorsal views of the A,B) pre-tectum (Th1 group 7) and A′,B′) hypothalamus (Th1 group 13) in 5 dpf control and trpm7 mutant larvae, as indicated, processed to reveal anti-5HT (red) and anti-Th1 (green) immunoreactivity (IR). Th1 IR cells were reduced in mutants (quantified in Fig. 4), 5HT IR cells were normal in number (below). Scale bar in A= 30 μm and applies to A-D; scale bar in A′= 50 μm and applies to A′–B′ and E, F. C,D) Dorsal views of 5 dpf Tg(dat:gfp) larvae focused on the pretectum (group 7). GFP-expressing neurons were equally abundant in trpm7 mutants and controls (see panel G). E,F) Ventral view of hypothalamus (group 13) in embryos of the indicated genotype processed to reveal dat expression by in situ hybridization. G) Bar chart indicating numbers of 5HT IR and GFP-expressing neurons within the pretectum (group 7) of trpm7 mutants (or trpm7 mutant; Tg(dat:gfp) transgenic) and controls. Number of neurons was not significantly different between the genotypes. (With anti-Hu at 5 dpf tails of control larvae had 32 ± 0.4 dorsal root ganglia neurons while mutant larvae had 31 ± 0.5, where ± denotes SEM). H) qRT-PCR analysis of mRNA levels of th1, th2, dat, and bdnf. Asterisks indicate significant difference; * p < 0.001. Error bars represent SEM.

