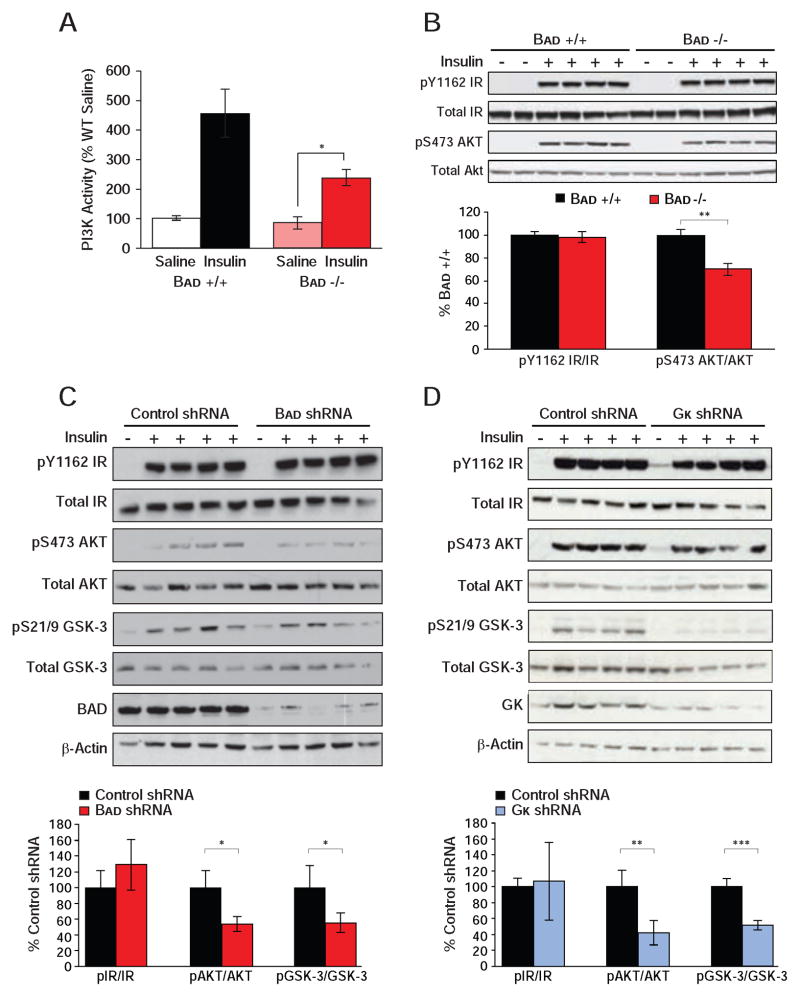
Figure 6. Altered insulin signaling upon hepatic manipulation of BAD and GK.
(A) IRS-1-associated PI3K activity in liver of Bad +/+ and −/− mice injected with saline or insulin after an overnight fast (n=10 per genotype).
(B) Phosphorylation of the insulin receptor (IR) and AKT in liver of Bad +/+ and −/− mice treated as in (A). Bar graphs quantitate relative insulin induction of IR and AKT phosphorylation (n=4).
(C–D) Insulin signaling in liver samples isolated from C57BL/6J mice following hepatic knockdown of Bad (C) and Gk (D). Bar graphs quantitate relative insulin induction of IR, AKT, and GSK-3 phosphorylation (n=4).
Error bars, ± SEM. *p < 0.05; **p < 0.01, ***p < 0.001.
See also Figure S5.

