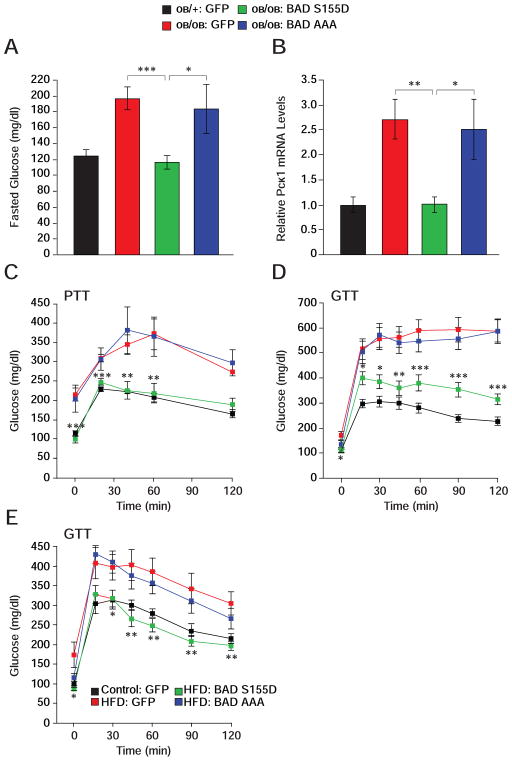
Figure 7. Metabolic effects of BAD in ob/ob and HFD-treated mice.
(A–D) Fasting glucose levels (A), liver Pck1 mRNA abundance (B), pyruvate (C) and glucose
(D) tolerance tests following hepatic reconstitution of ob/ob mice with the indicated adenoviruses (n=10–14). Asterisks in (C–D) compare ob/ob mice treated with BAD S155D vs. GFP adenoviruses.
(E) GTT in C57BL/6J mice subjected to high-fat diet for 10 weeks prior to hepatic reconstitution with the indicated adenoviruses (n=9). Asterisks in (E) compare HFD mice treated with BAD S155D vs. GFP adenoviruses.
Error bars, ± SEM. *p < 0.05; **p < 0.01, ***p < 0.001.
See also Figure S6.

