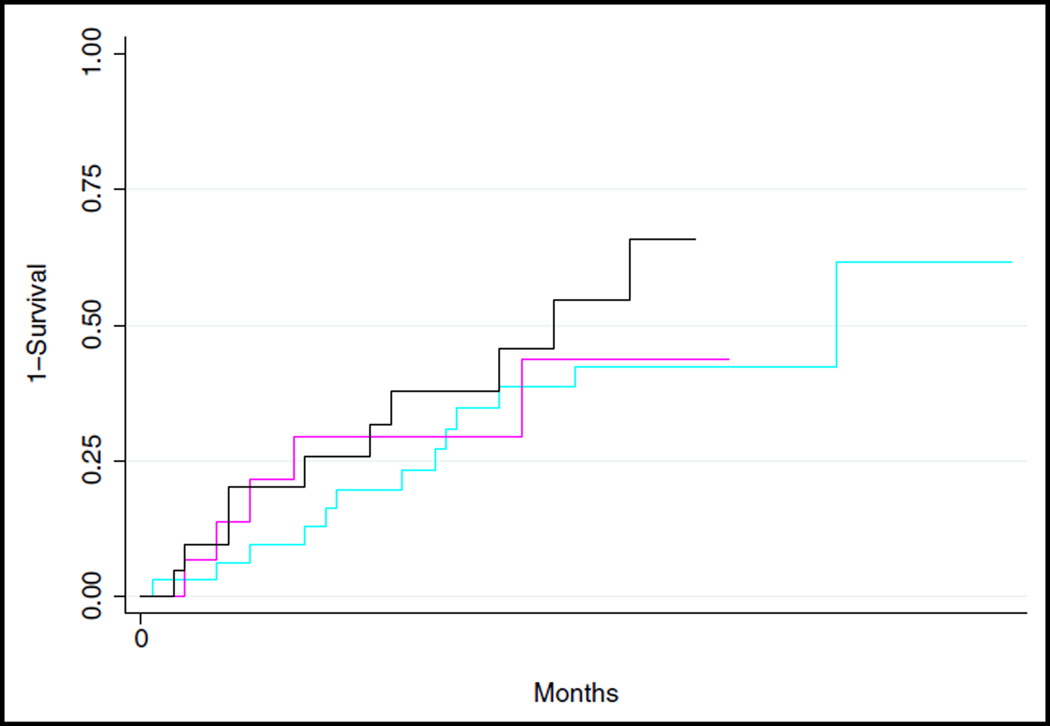
FIGURE 2.
Kaplan–Meier plots comparing the risk of recurrence of depression among groups. Note: Cyan line represents the bereavement-related depression (BRD) (within 2 months of loss) group. Magenta line represents the later bereavement depression (LBD) group. Black line indicates the controls with depression (CD) group. Wilcoxon test: χ22 = 1.29, p = .52. Log-rank test: χ22 = 1.56, p = .46.

