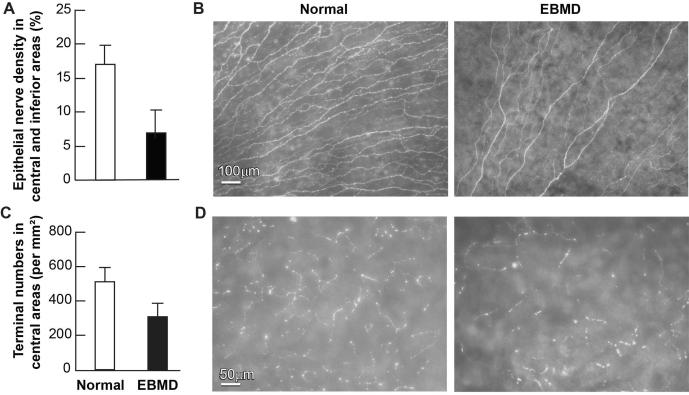
Figure 3.
Effect of EBMD on corneal subbasal nerve density and nerve terminals. (A) Subbasal nerve density in the central area of the inferior quadrant was calculated as percentage of total area in each image. A total of 36 images were taken at a magnification of 10 × lens from each eye. These images were changed to grayscale mode and placed against a white background to get better contrast using Photoshop imaging software. The nerve fibers of each image were carefully drawn with four-pixel lines following the course of each fiber. Percentage of nerve area was quantified for each image using the image analysis program. Data are expressed as average ± SD. (B) Representative images of EBMD and normal subbasal nerves. (C) Number of nerve terminals. 20 images for each eye from the central corneas were used. Nerve terminals in superficial epithelia in each image were counted. Because each image took up an area of 0.335 mm2, the terminal numbers per mm2 were calculated. Data are expressed as average ± SD. (D) Representative images of nerve terminals in both eyes.

