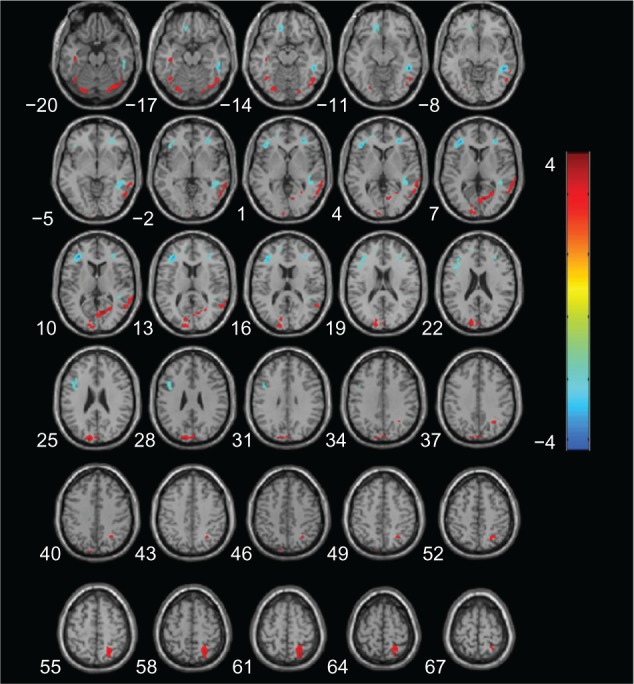
Figure 3.

Statistical parametric map of significant cerebral blood flow differences between aMCI and CN patients.
Notes: Z axial coordinates in the Talairach space are from 20 to 67 mm, in increments of 3 mm. An AlphaSim correction was applied to the threshold significance level (P<0.05). Red = hypoperfusion, and blue = hyperperfusion, in aMCI.
Abbreviations: aMCI, amnestic mild cognitive impairment; CN, cognitively normal.
