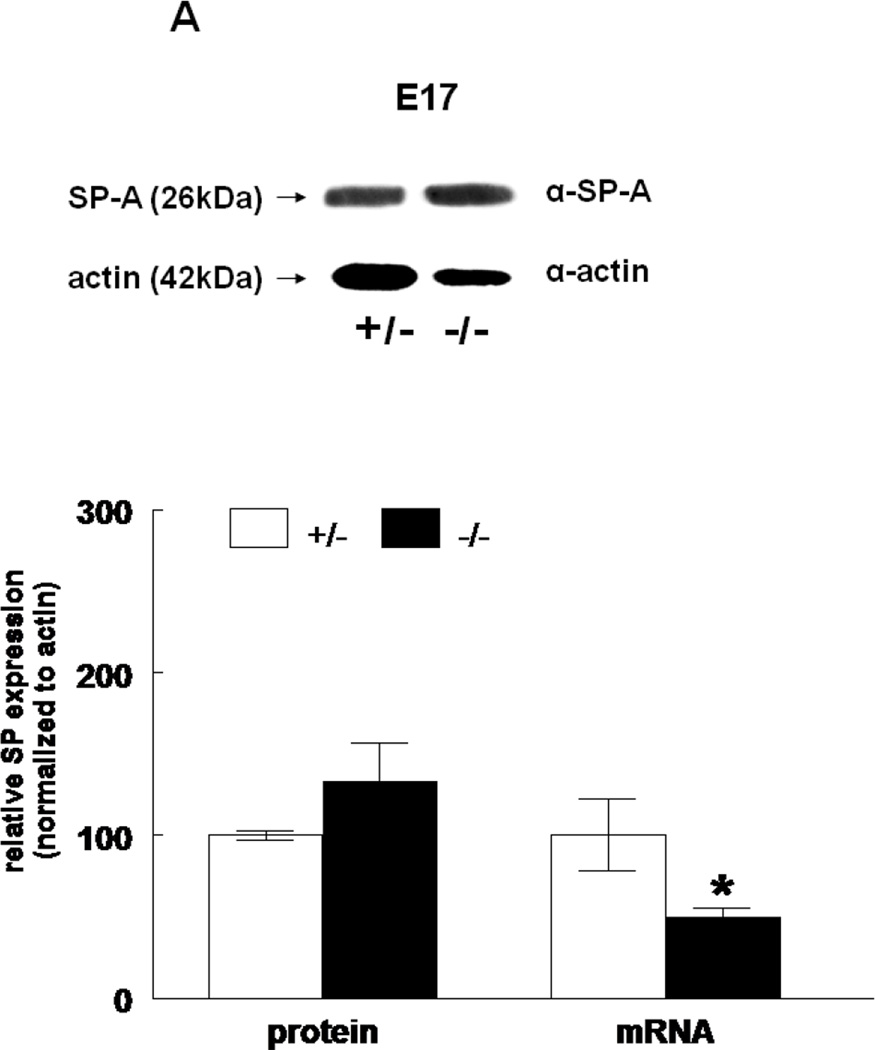
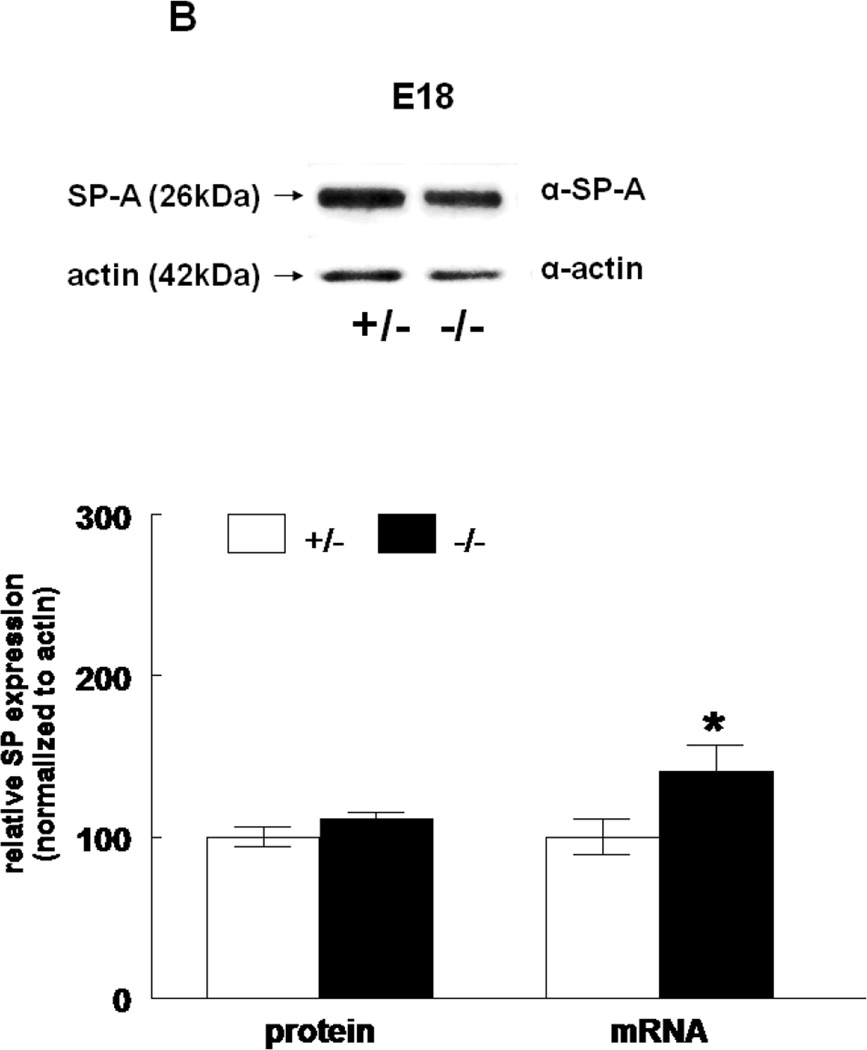
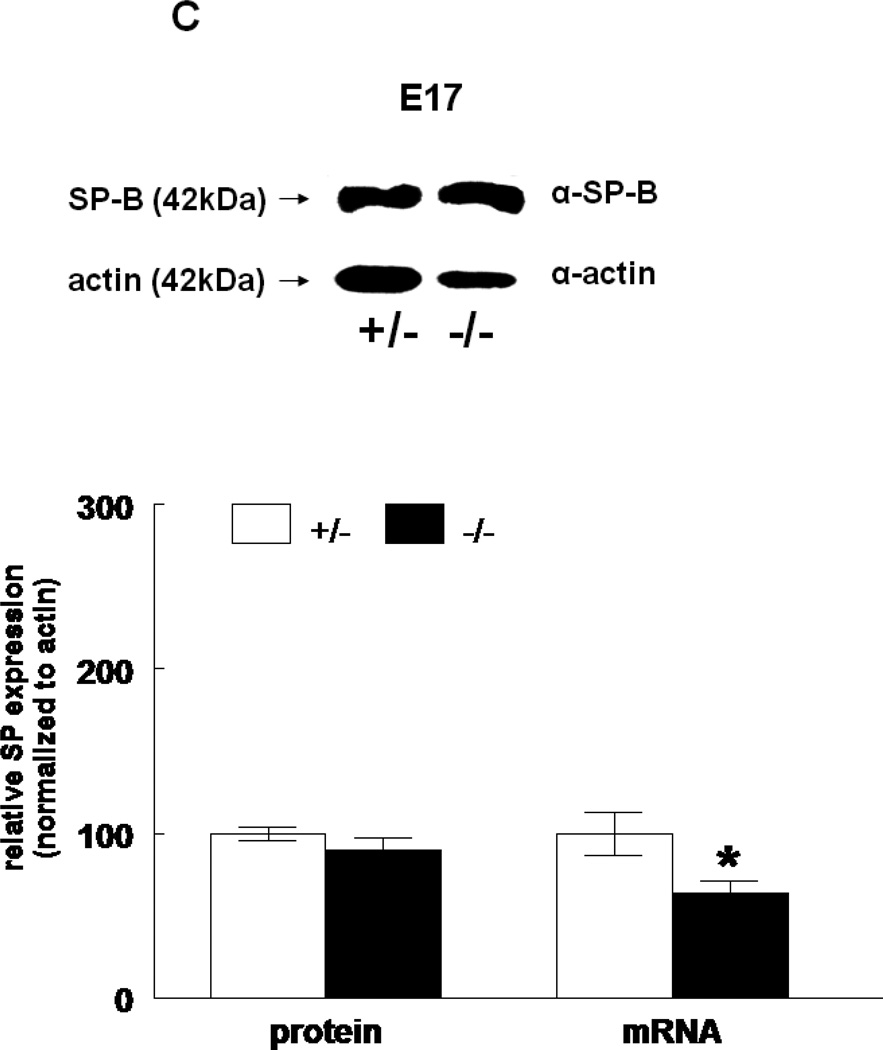
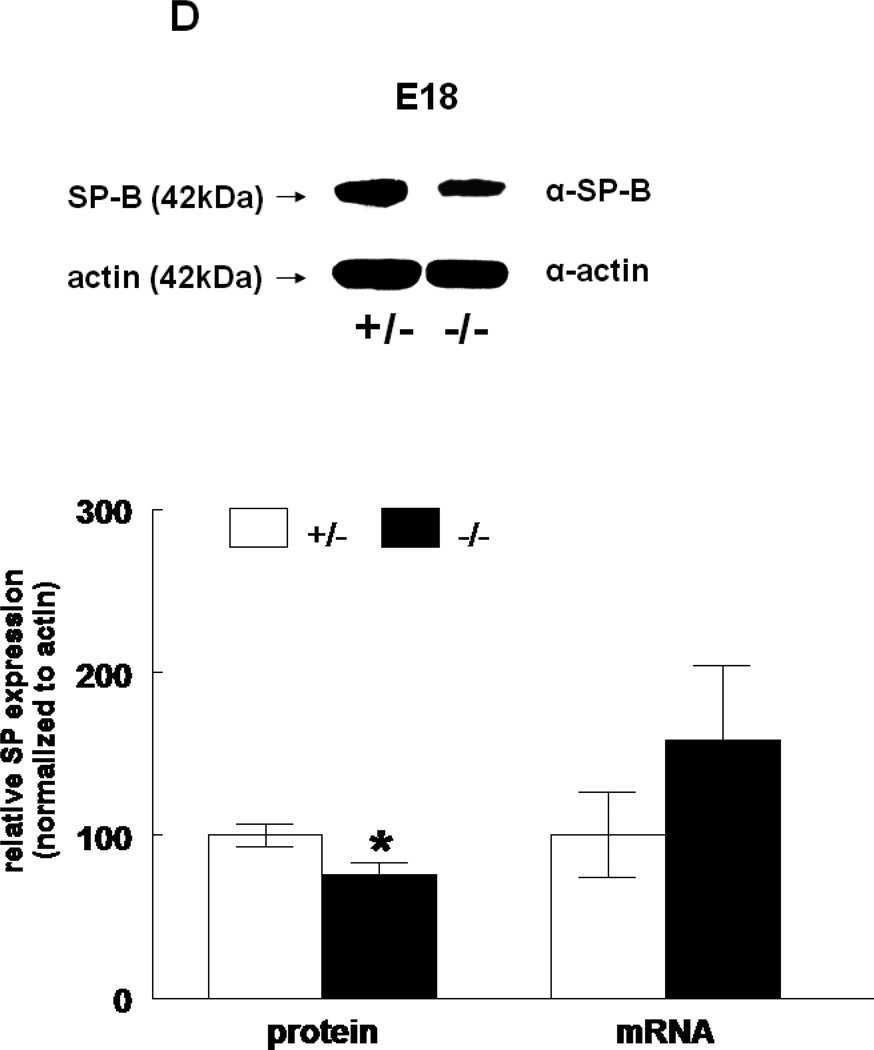
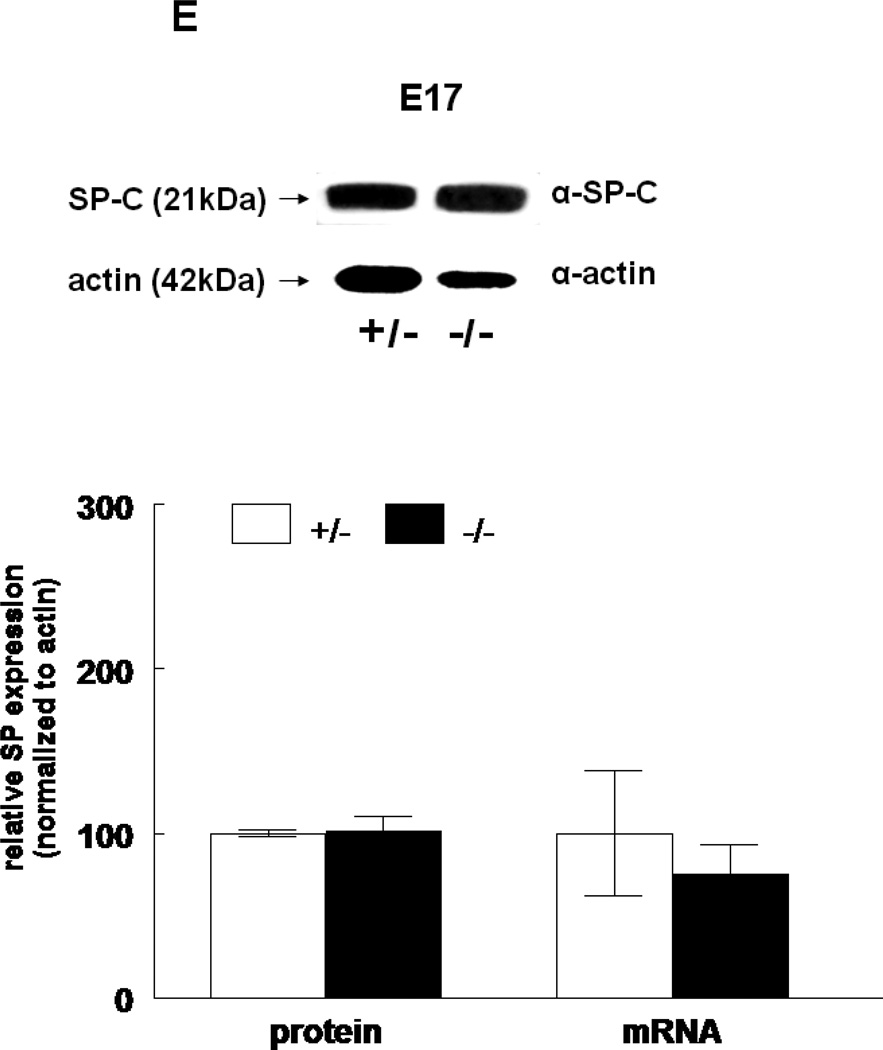
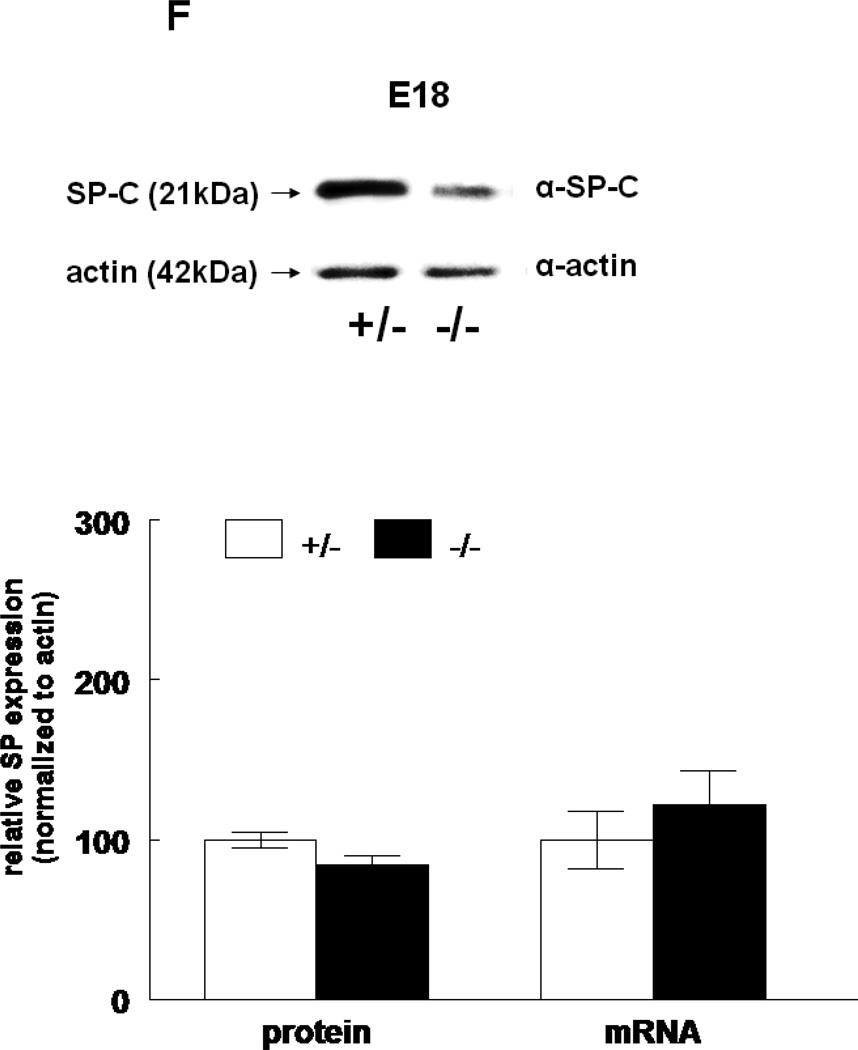
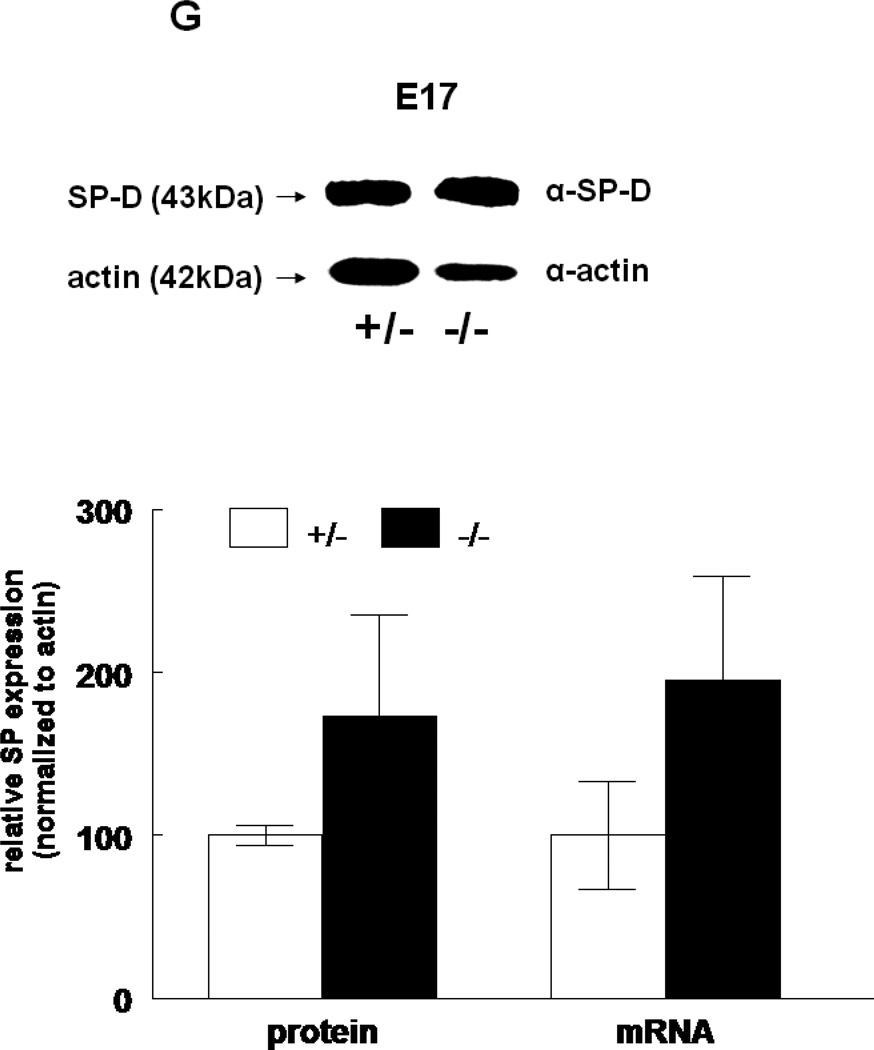
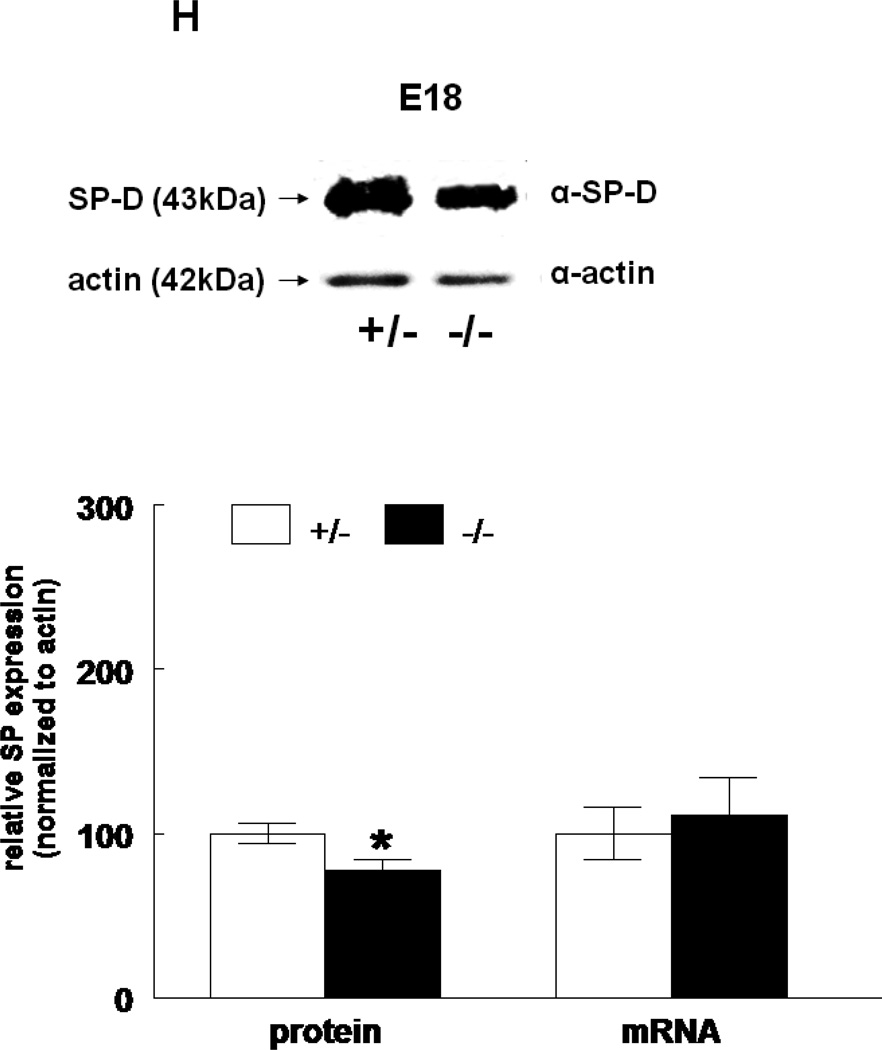
Figure 3.
SP expression. SP-A, SP-B, SP-C, SP-C, and SP-D protein expression in E17 (A, C, E, G, respectively) and E18 (B, D, F, H, respectively) lungs. Representative Western blot from HER4heart+/− (left) and HER4heart−/− (right) lung homogenates. Quantification of protein (left) and mRNA (right) expression in lung homogenates from HER4heart+/− (white bars) and HER4heart−/− (black bars) transgenic mice. Values are presented as mean ± SEM, N= 4*: P<0.05.

