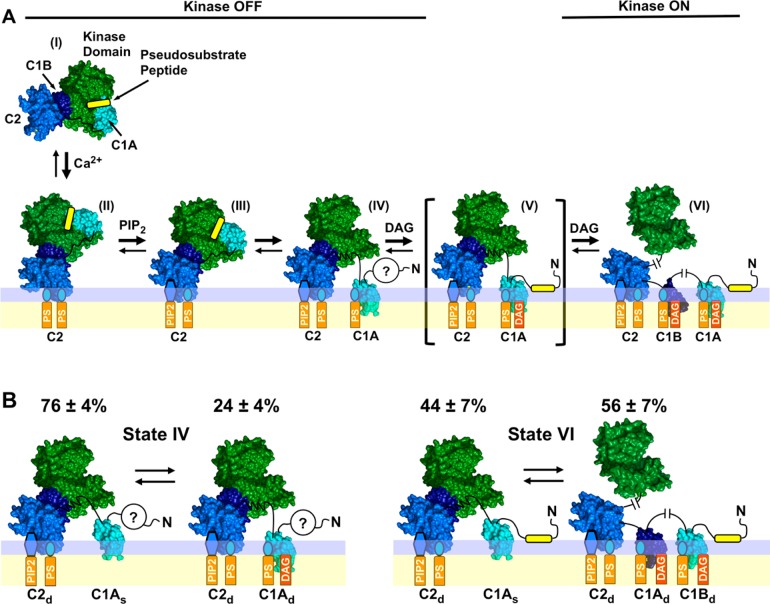
Figure 10.
Expanded PKC activation model and subpopulations of two PKCα activation states detected by single-molecule diffusion studies. (A) Expanded structural model of PKC activation showing the newly discovered, predominant, pre-DAG intermediate (IV) in which both the C1A and C2 domains contact the bilayer. Four of the indicated states [(II), (III), (V), and (VI)] are similar to those of a previous model,28 while pre-DAG intermediate (IV) is novel. The indicated structures are supported by available evidence, but current data do not rule out alternative structures (Figure S2 of the Supporting Information). (B) Single-molecule TIRF analysis of PKCα single-molecule diffusion shows that states (IV) and (VI) in the expanded activation reaction (see also Figure 7) are each comprised of two major subpopulations as indicated. The relative population sizes were determined by multistate fits of the single-molecule diffusion data on each type of supported bilayer (Table S2 of the Supporting Information). Domain subscripts indicate the relative degree of insertion of the protein into the membrane (s for shallow and d for deep). Question marks indicate that the status of the N-terminal pseudosubstrate region is unresolved in the inactive, pre-DAG intermediate (IV): because the friction of the peptide–bilayer contact is expected to be negligible, the diffusion analysis does not ascertain whether the peptide remains bound to the kinase active site or binds to the bilayer as proposed for the active state.28,92

