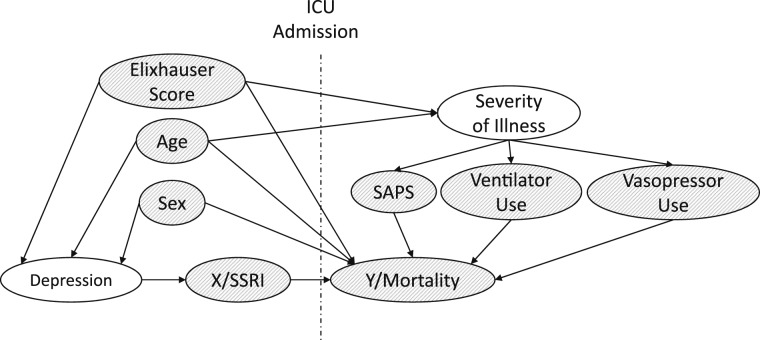
Figure 1.
Directed acyclic graph describing the relationship between covariates and the outcome. Note that preadmission and postadmission factors are separated by the labeled vertical line. This graph depicts our model of the observed causal relations connecting pre-ICU admission SSRI use with other confounders and modifier effects. These connections are represented by the arrow lines, with the arrow positioned specifically at the impacted factor. For example, age may have an impact on the preadmission occurrence of depression as well as on the severity of illness and mortality after admission. The figure represents a visual display of our data-driven examination of possible causal factors on mortality (Y) in addition to the causal factor of SSRI use (X). Observed variables are shaded, whereas unobserved variables are clear. Age, sex, and Elixhauser score were used as the confounding variables for SSRI use, because they share a “back door” path that needs to be adjusted for. Other ICU-specific modifier effects, such as SAPS, ventilator use, and vasopressor use, are not confounding but are strongly tied to the outcome Y (mortality) in the ICU setting and are, therefore, adjusted for in the model. Note that the precise vertical or horizontal positions of the variables do not imply more or less quantitative impact (eg, severity of illness is not a more impactful factor than the three grouped below it). The positioning of the factors is designed to facilitate understanding by eliminating or minimizing the complexity of the relationship arrows (eg, avoiding overlaps so far as possible). SAPS = Simplified Acute Physiology Score; SSRI = selective serotonin reuptake inhibitor.

