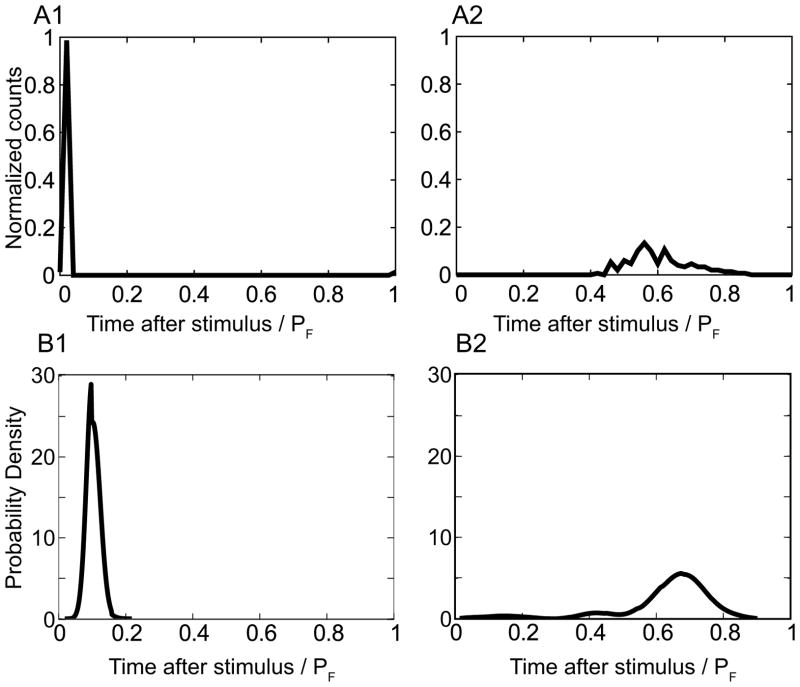
Figure 5.
Distribution of observable time after the stimulus is also in qualitative agreement with theoretical predictions. A) Normalized experimental distribution for the same examples as in Fig 4 with A1) depolarizing and A2) hyperpolarizing pulses. B. Theoretical predictions for B1) depolarizing and B2) hyperpolarizing pulses with the same model parameters as in Figure 4.

