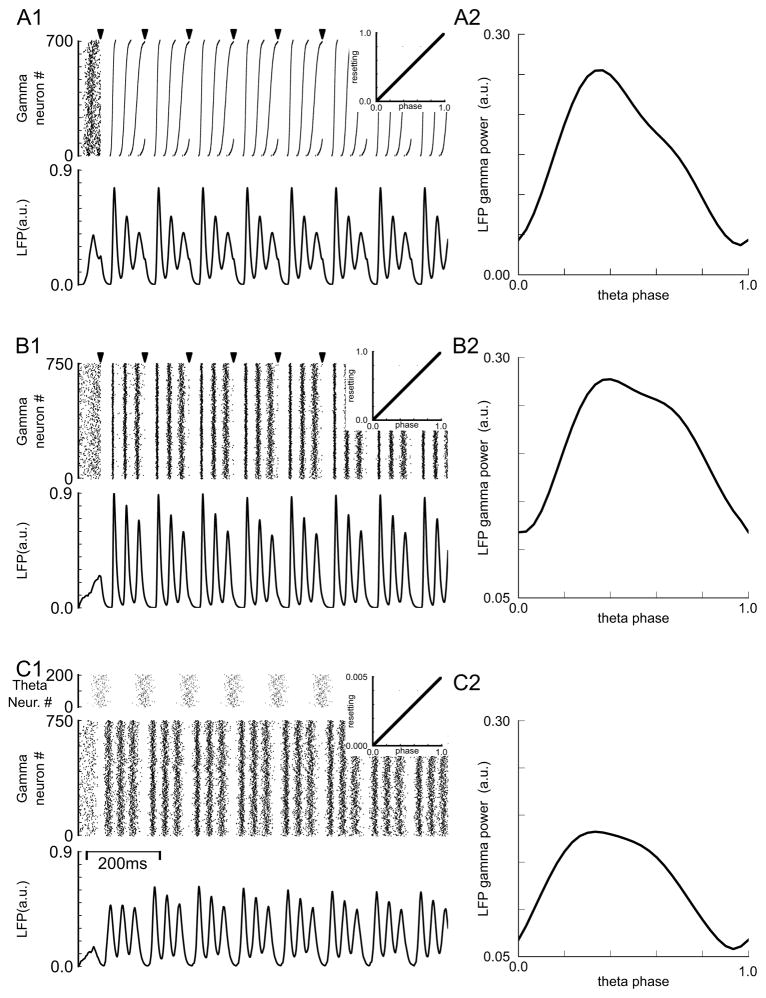
Figure 7.
Pulse coupled phase oscillator simulations of theta gamma nesting. A1. Raster diagram (top panel) and LFP (bottom panel) for population of 700 gamma modules. Periods were normally distributed with 33 ms mean and 2.7 ms standard deviation. For the raster diagram modules were sorted from fastest (bottom) to slowest (top). Pulsatile periodic input (arrow marks at top of raster diagram) was applied with a period of 120 ms. The linear PRC is shown in the insets. A2. Dependence of gamma power on theta phase. B. The input was the same as in A but 750 modules with instantaneous intrinsic periods determined by a randomly initialized O-U process were used instead of Gaussian distributed constant periods. The parameters for the O-U process were μ=33 σ=0.1 τ=165. C. Same as in B, but the theta input was arbitrarily divided into 200 proportionally weaker periodic inputs with initial phases distributed normally with mean of 0.5 and standard deviation of 0.0925. The PRC was scaled proportionally (note different scale for inset). Gamma peaks in the LFP occur at the following theta phase within the theta cycle: A1: 0.27(98.8°), 0.45(162.4°), 0.81(291.7°), B1: 0.27(99.1°), 0.55(198.0°), 0.82(297.0°), C1: 0.17(64.1°), 0.45(163.4°), 0.81(293.0°).

