
Figure 2.
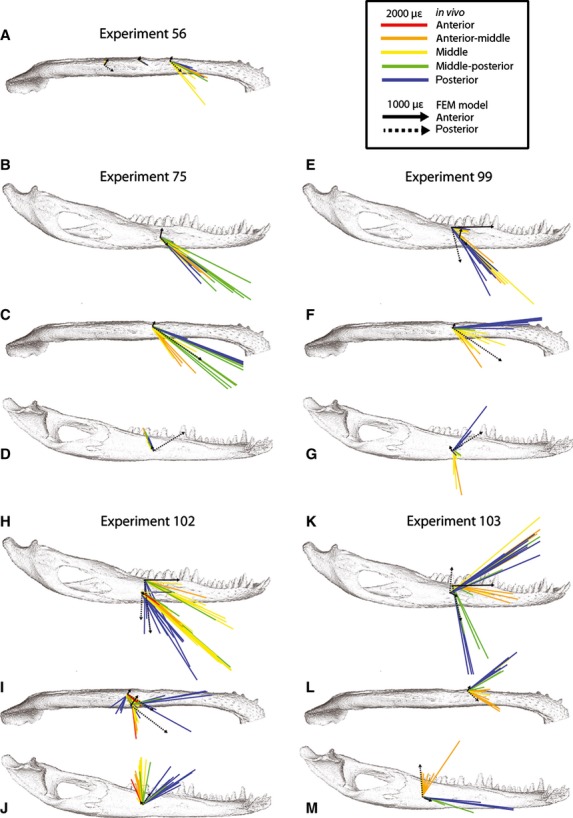
Orientations of maximum principal strain (ε1) on the working side mandible. Colored arrows represent variations in bite point in in vivo experiments (see inset for color key); strain orientation for every recorded bite during experiments is shown for every gage site in five experiments for lateral (B,E,H,K), ventral (A,C,F,I,L) and medial (D,G,J,M) views. Black arrows represent strain orientations during anterior (solid line) and posterior bites (broken line) in the FEM (finite element model) in areas corresponding to in vivo gage sites. Note difference in scale between in vivo and FEM strain in the inset.