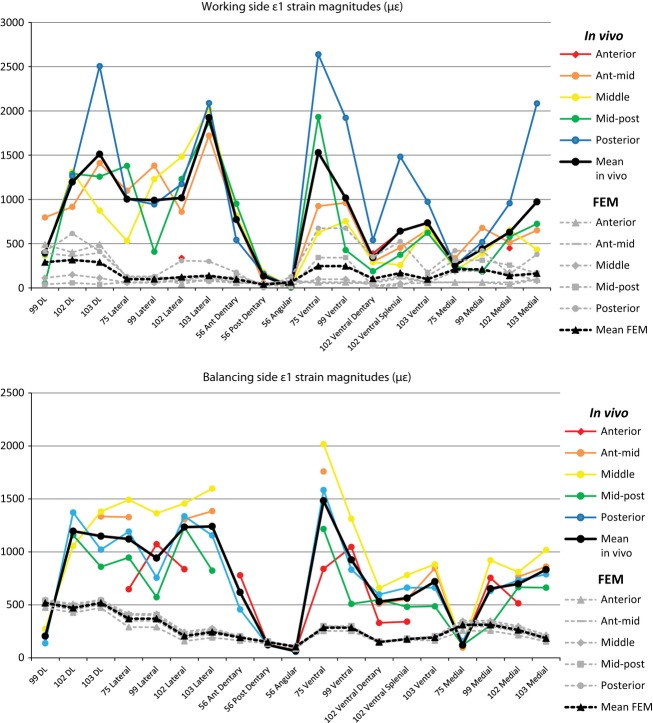
Figure 5.
Mean in vivo and FEM (finite element model) ε1 strain magnitudes. Plots illustrate maximum principal strain at 19 gage sites and their corresponding sites in the FEM. The upper plot shows results from the working side and the lower plot shows results from the balancing side. Both the mean ε1 strains within each gage site and the mean value during biting at different locations are shown. Missing areas of the in vivo plots indicate no data was collected for this bite point at this gage site.

