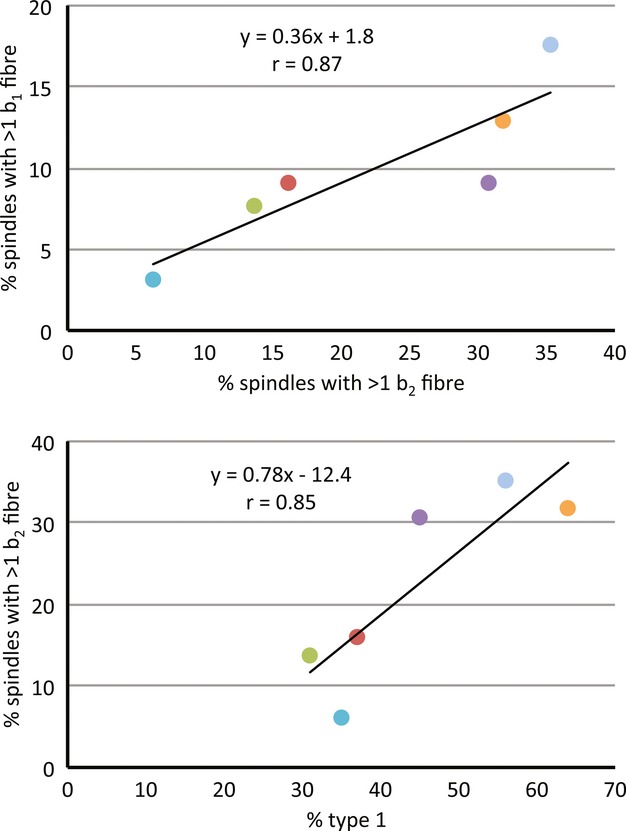
Figure 4.

Scatter plots of strain means with least-squares fitted regression lines to show by strain the relationships between: (top) the proportions of spindles with > one bag1 fibre and those with > one bag2 fibre; (bottom) the proportions of spindles with > one bag2 fibre and extrafusal fibres of type 1. A similar relationship was observed between the proportions of spindles with > one bag1 fibre and extrafusal fibres of type 1 (not shown). Symbols are colour-coded to indicate strain as in Fig. 2.
