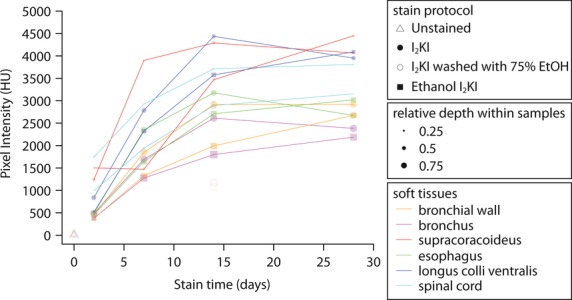
Figure 4.

Iodine staining intensities for different staining durations and regions within late stage quail embryos. 95% confidence intervals, provided by CTAn, are not shown in the graph because they are too small (< 39.0 HU). Note that the mean CT value of each region is used to present the overall trends of the diffusion rate of the regions because some regions present bimodal CT value distribution.
