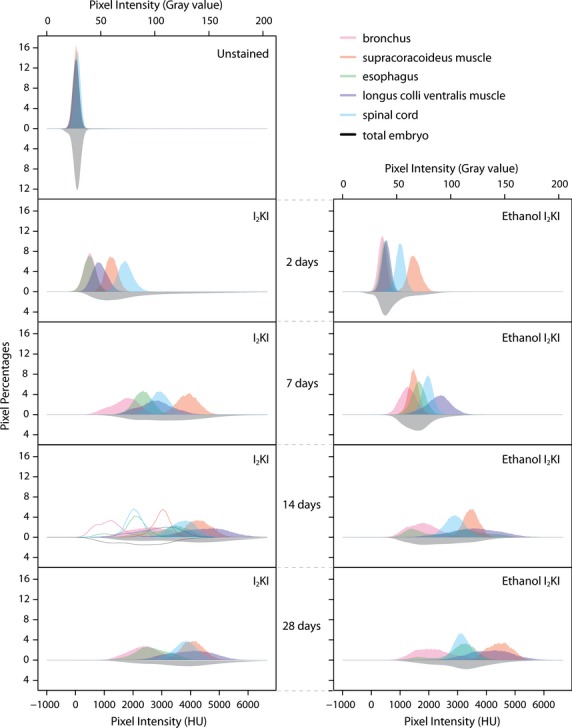
Figure 6.

Histograms of pixel percentages in both CT and gray values for selected organs and whole quail embryos for unstained and I2KI, I2KI washed with ethanol, and ethanol I2KI stained specimens. The histogram of the total embryo in all samples is flipped along the x-axes. The range in pixel intensity was cut in the graphs at 6668 HU and 204 gray value for clarity, even though all the ranges for all organs and whole embryos extended to the calculated limit of CT values of 8585 HU and gray values of 255, but at near zero percentages. Histograms of an embryo washed with 75% ethanol after 14 days of I2KI staining, are presented as outlines in the same graph as 14 days of I2KI staining to show the effect of an ethanol wash of the stained embryo.
