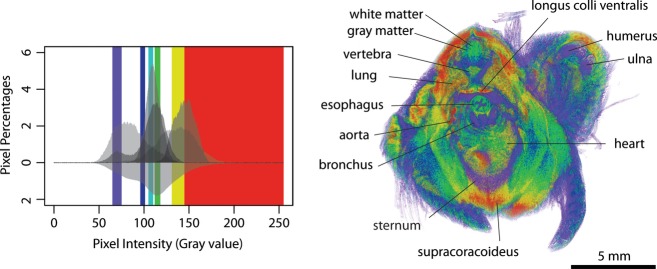
Figure 7.

Histogram-based segmentation via volume rendering of a quail embryo stained with ethanol I2KI for 28 days. The histogram is from Fig. 6. The color bars in the histogram represent optimal threshold ranges for the selected soft tissues: cartilage and bone in purple (65–75 gray value), white matter and bronchial wall in blue (96–101 gray value), white matter and esophageal and bronchial walls in light blue (105–110 gray value), gray matter and esophageal and bronchial walls in green (112–118 gray value) and two muscles (supracoracoideus and longus colli ventralis) in yellow (131–145 gray value). The values above 145 were displayed in red to show other soft tissues. The full range of pixel intensities is presented, 0–255.
