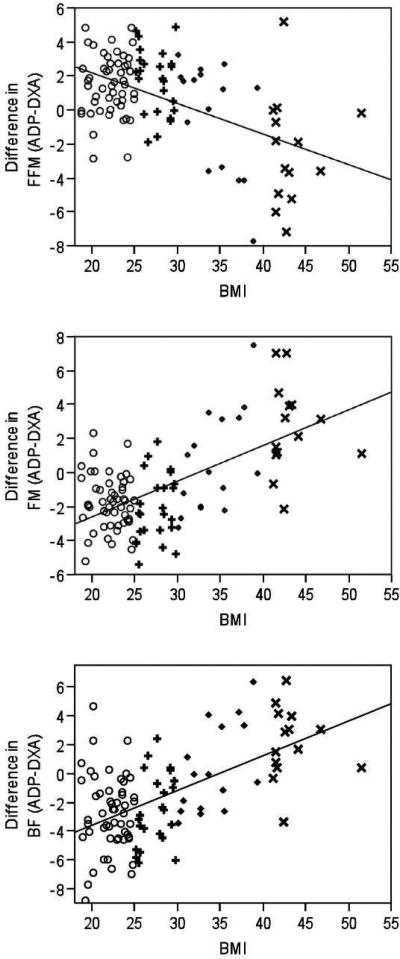
Figure 2.
Agreement between fat free mass (FFM, kg; A), fat mass (FM, kg; B), and body fat (BF, %; C) estimated by air displacement plethysmography and dual x-ray absorptiometry. Solid line represents the difference of ADP from DXA. Dashed lines represent the confidence intervals. The BMI of the participants are represented with the following symbols: ○normal weight, +overweight, ◇obese and ×extremely obese.

