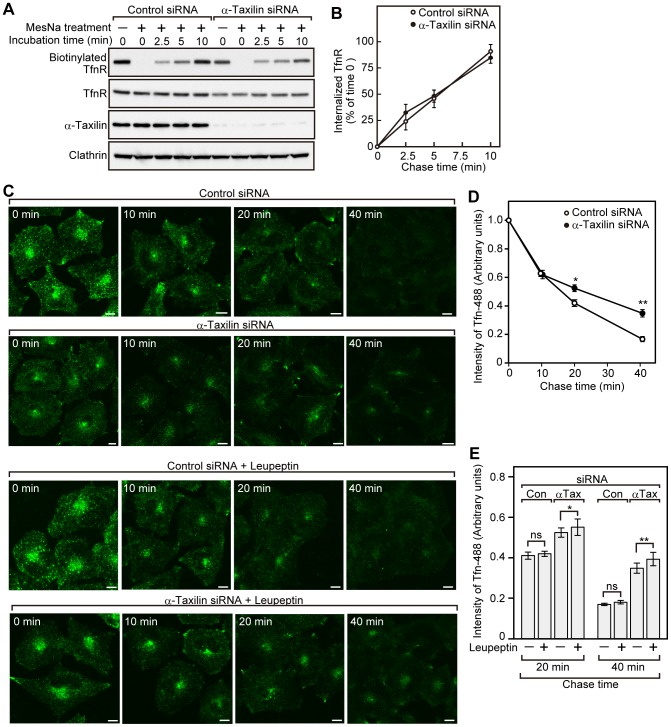
Figure 2. Knockdown of α-taxilin impedes the recycling of Tfn.
(A) HeLaS3 cells transfected with control or α-taxilin siRNA (#3) were treated with sulfo-NHS-SS-biotin at 4°C, and then the cells were incubated at 37°C for the indicated periods of time. Cells were treated with MesNa to remove biotin remaining on the plasma membrane, and then the cell lysates were precipitated with neutravidin-agarose beads. The precipitates were probed with an anti-TfnR antibody (biotinylated TfnR). The cell lysates used for precipitation were probed with anti-TfnR, anti-α-taxilin and anti-clathrin heavy chain antibodies. The results shown are representative of three independent experiments. (B) The amount of internalized TfnR in (A) was quantified using Image J software. The results shown are means ± s.e.m. of the ratio of internalized TfnR at the indicated time periods to biotinylated TfnR at time zero without MesNa treatment from three independent experiments. P-values (control cells vs. α-taxilin knockdown cells at 2.5, 5, 10 min) determined by Student's t-test was not significant. (C) HeLaS3 cells transfected with control or α-taxilin siRNA (#3) were serum starved for 3 h, and then the cells were incubated with Tfn-488 at 37°C for 1 h. In the case of treatment with leupeptin, the cells were preincubated with leupeptin (200 μg/ml) 1 h prior to Tfn-488 labeling. After washing out unbound Tfn-488, the cells were incubated at 37°C for various time periods in the presence or absence of leupeptin (200 μg/ml). Scale bars, 10 μm. (D) The intensity of Tfn-488 signal of HeLaS3 cells untreated with leupeptin in (C) was expressed as signal intensity per unit area. At each time point, signal intensity of at least 20 cells was measured from three independent experiments. The results shown are means ± s.e.m. of the ratio of Tfn-488 at each time point to Tfn-488 at time zero. Values at time zero are set to 1.0. P-values (control cells vs. α-taxilin knockdown cells at 10, 20, 40 min) are determined by Student's t-test. *, P<0.005; **, P<0.001. P-values at 10 min was not significant. (E) The intensity of Tfn-488 signal of HeLaS3 cells treated or untreated with 200 μg/ml leupeptin in (C) was calculated as signal intensity per unit area. At each time point, signal intensity of at least 20 cells was measured from three independent experiments. The results shown are means ± s.e.m. of the ratio of Tfn-488 at 20 and 40 min to Tfn-488 at time zero. Values at time zero are set to 1.0. P-values (the cells untreated with leupeptin vs. the cells treated with leupeptin at 20 and 40 min) are determined by Student's t-test. *, P<0.05; **, P<0.05; ns, not significant. Con, control; α-Tax, α-taxilin.

