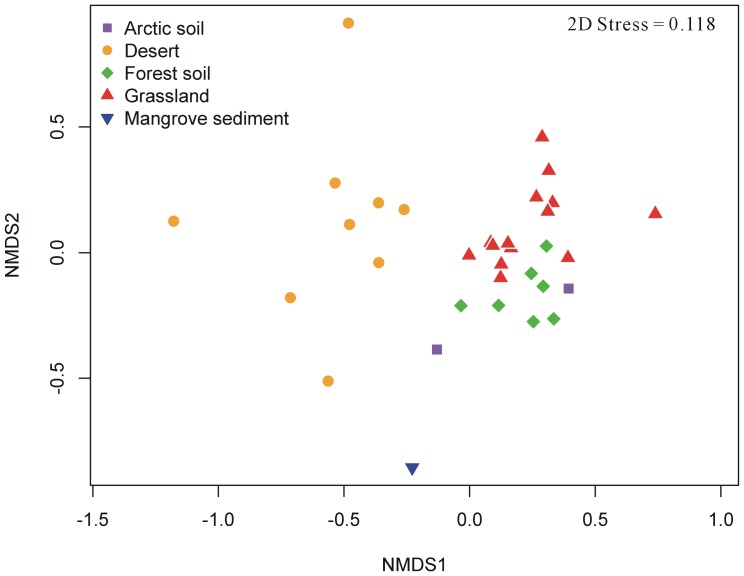
Figure 2. A nonmetric multidimensional scaling (NMDS) plot showing diversity of soil ecosystems.
A Bray-Curtis distance similarity matrix was calculated based on the pairwise taxonomic profiles of 33 soil samples and used to generate NMDS coordinates of each sample. The distance linking two samples is shorter, indicating higher similarity between these samples. Samples from five soil sites were illustrated by different symbols and colors.

