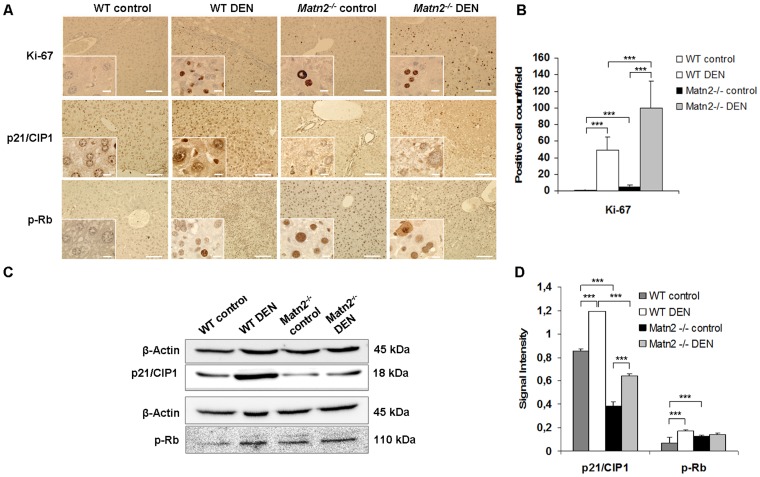
Figure 2. Representative immunohistochemical stains of WT control, WT DEN-treated, Matn2-/- control and Matn2-/- DEN-treated mouse livers (A).
Scale bars represent 0.1(insets) for paraffin-embedded samples. Changes in cell cycle regulation. Ki-67 proliferation index (B). In knockout samples an average of 4.1 Ki-67 positive cells were counted per field of view compared to 0.7 in WT (p<0.001) (B). Results are expressed as mean ± SD. Representative Western blots of cell cycle regulatory proteins (C) in WT control, WT DEN-treated, Matn2-/- control and Matn2-/- DEN-treated mouse livers. Diagrams of band intensities expressed as values normalized to β-Actin loading control (D). Data are expressed as mean ± SD, n = 3.

