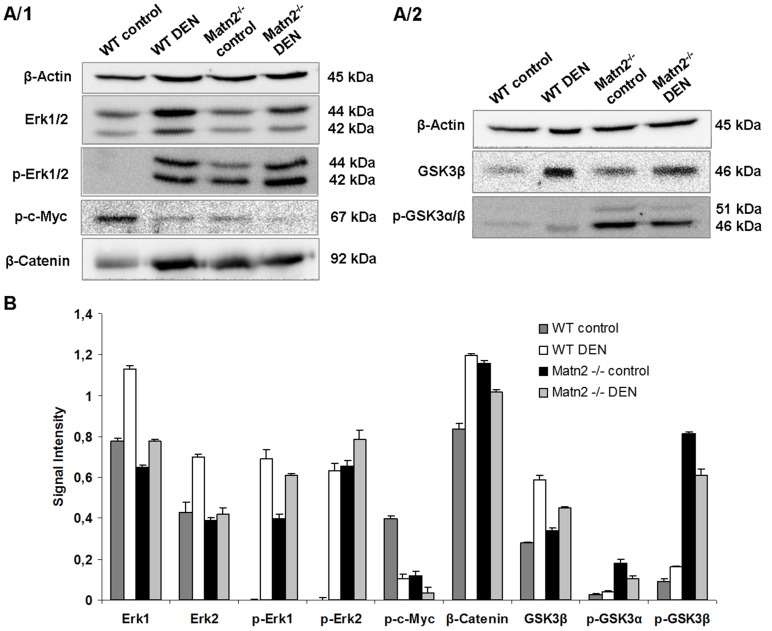
Figure 3. Representative Western blots of intracellular regulatory proteins.
in WT control, WT DEN-treated, Matn2-/- control and Matn2-/- DEN-treated mouse livers (A/1, A/2). Results of densitometrical analysis of band intensities expressed as values normalized to β-Actin loading control (B). Data are expressed as mean ± SD, n = 3.

