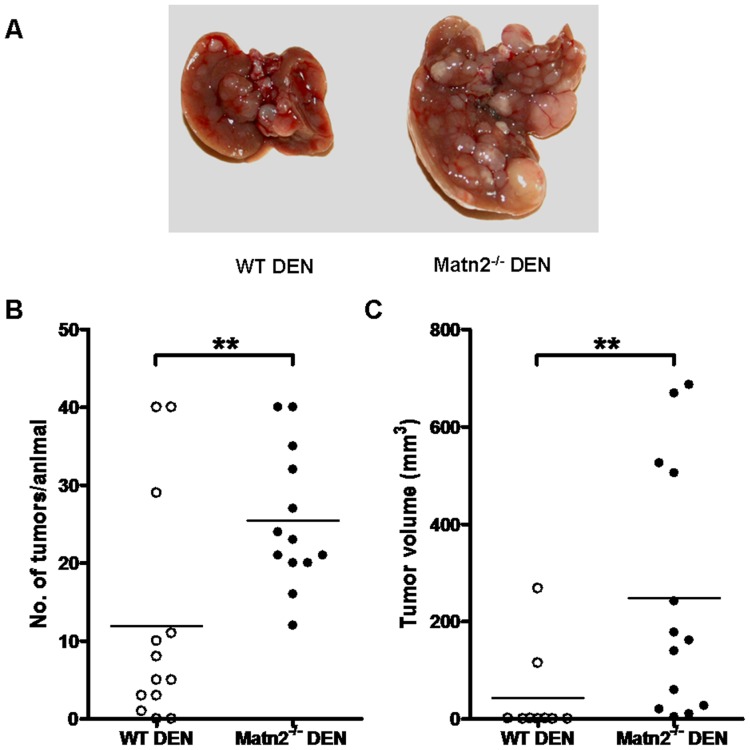
Figure 6. Results of DEN treatment in WT and Matn2-/- animals.
Representative pictures of the macroscopic appearance of WT and Matn2-/- DEN-treated mouse livers. 10 months after DEN exposure the number and size of macroscopic tumors were greater in Matn2-/- than in WT livers (A). The number of tumors/animal (B) and the tumor volume (C) were significantly higher in Matn2-/- mice compared to WT mice after DEN-treatment (n = 9 for WT DEN, n = 13 for Matn2-/- DEN, **p<0.01).

