
Figure 7. Schematic illustration of the predicted signaling mechanisms in Matn2-/- mice.
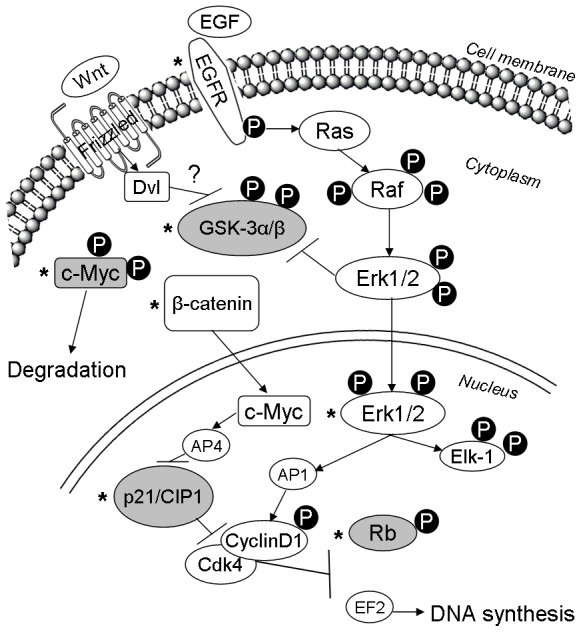
Molecules studied in this work are labeled by asterisks. Empty boxes show upregulation and/or activation; gray boxes indicate downregulation and/or inactivation of the protein.