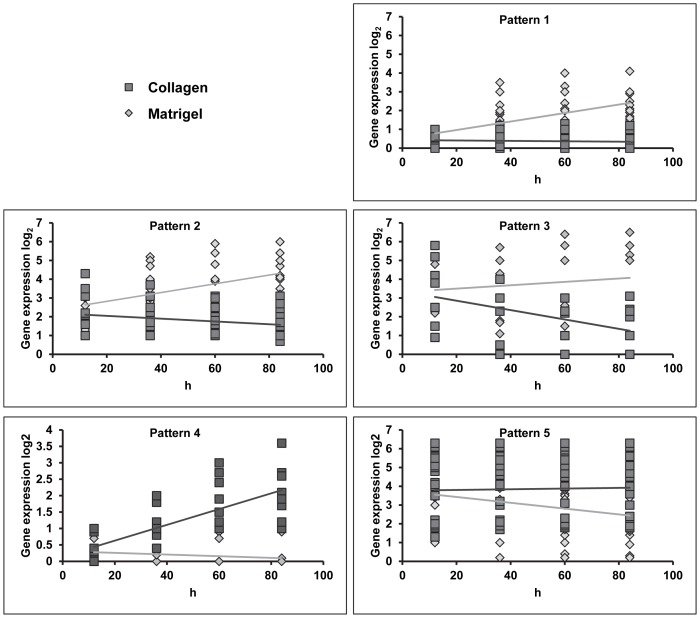
Figure 2. Candidate genes' expression patterns.
Genes expressed differentially in hAT2 cells on collagen compared to Matrigel with P<0.01 were analyzed based on expression dynamics and sorted into one of five expression patterns. Gene expression data were graphed in Microsoft Excel as scatterplot graphs and means of expression were drawn which illustrate the patterns. Patterns 1, 2, and 3 include genes that are more highly expressed in cells on Matrigel than on collagen. Pattern 1 is characteristic of genes with low expression on both substrates at day 0 that increases only on Matrigel over time. Patterns 2 and 3 are characteristic of genes expressed at high levels on both substrates at day 0 and either increase on Matrigel while remaining stable (Pattern 2) or decrease (Pattern 3) in cells on collagen. Note that due to quantitative differences in baseline expression, Pattern 3 genes do not cluster at a particular y-axis value but do exhibit similar dynamics over their time courses. Patterns 4 and 5 include genes with higher expression in cells on collagen than on Matrigel. Pattern 4 genes exhibit very low expression on both substrates at Day 0 (12 hours after attachment) which increases steadily with time on collagen, while expression on Matrigel remains very low. Pattern 5 genes start at a moderate or high level of expression on both substrates that decreases over time only in cells on Matrigel. Note that due to quantitative differences in baseline expression, Pattern 5 genes do not cluster at a particular y-axis value but do exhibit similar dynamics over their time courses.

