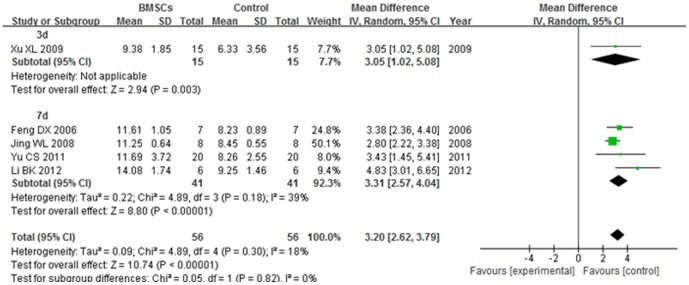
Figure 8. Forest plot of the differences in the BBB score of the BMSCs and control groups in different time subgroups at over 5 weeks after transplantation.
The BBB score of 3(WMD = 3.05; 95% CI, 1.02–5.08; P = 0.004). The BBB score of 7 d subgroup was significantly increased in the BMSCs group than the control group at over 5 weeks after BMSCs transplantation (WMD = 3.31; 95% CI, 2.57–4.04; P<0.00001). The overall BBB score was significantly increased in the BMSCs group than the control group at over 5 weeks after BMSCs transplantation (WMD = 3.20; 95% CI, 2.62–3.79; P<0.00001).

