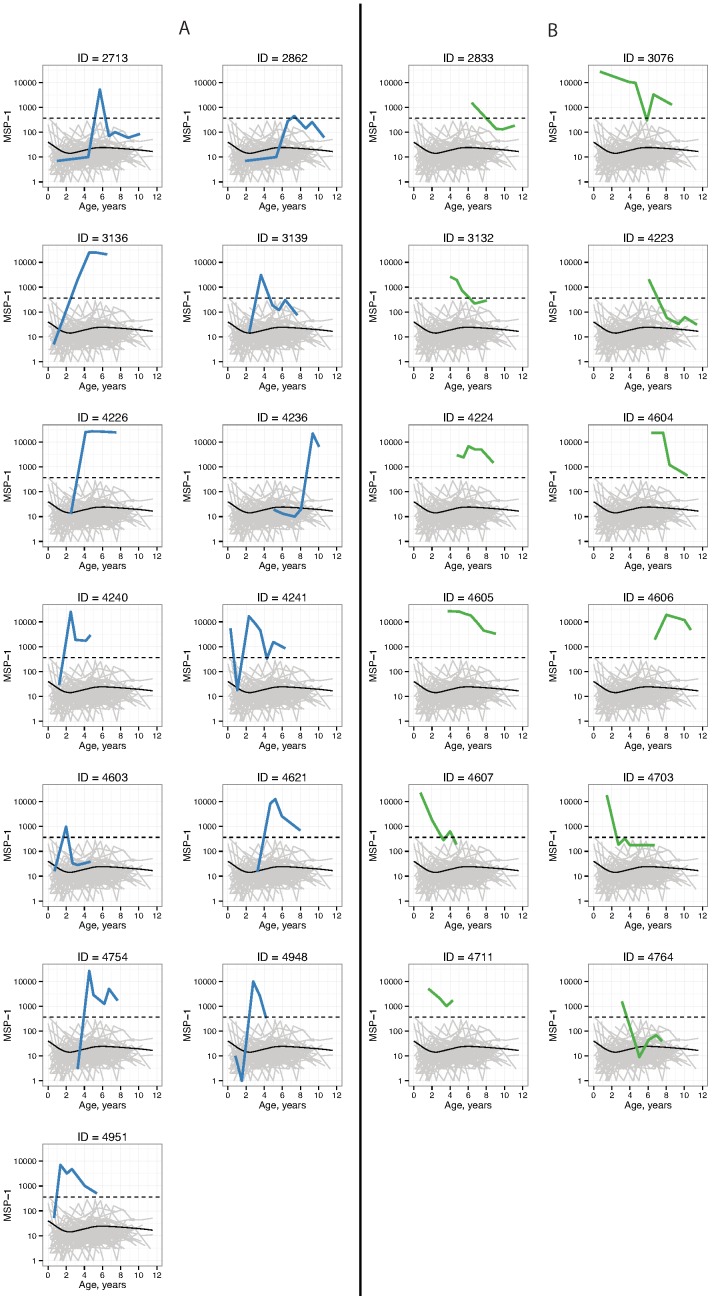
Figure 2. MSP-119 antibody optical density profiles for children in the Léogâne, Haiti longitudinal study, 1991–1999.
Panel A includes individuals with incident seroconversions, and panel B includes those who were seropositive at their first measurement. The dashed line marks the cutoff value (365) used to determine seropositive antibody levels. The light grey lines plot antibody profiles for seronegative children, and the solid black line in each plot is a loess smoother over the seronegative children antibody levels.

