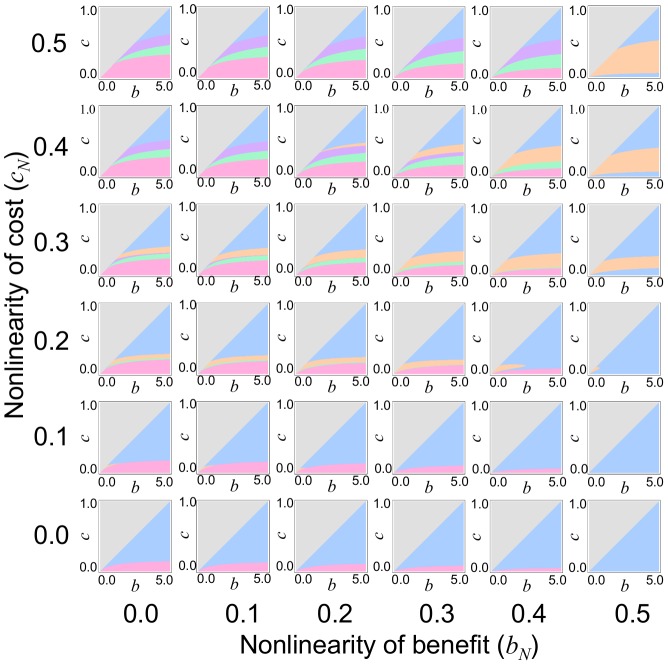
Figure 5. Effects of nonlinear benefit and cost functions.
Nonlinear benefit and cost functions yield the evolutionary outcomes (i) “No evolution” (gray), (ii) “Maximum evolution” (magenta), (iii) “Intermediate evolution” (blue), (iv) “Co-dependent coexistence” (orange), (v) “Parasitic coexistence by evolutionary branching” (purple), and (vi) “Parasitic coexistence by null mutation” (green). Parameter regions of these cases are delineated by the properties of their singular strategy (similar to Text S4); case (i) D(0)<0, case (ii) D(x)>0 for 0<x<1 and w(1,0)<0, case (vi) D(x)>0 for 0<x<1 and w(1,0)>0, case (iii) x* is CS and ESS-stable (i.e. D′(x*)<0 and E(x*)<0), case (iv) x* is CS but not ESS-stable (i.e. D′(x*)<0 and E(x*)>0) and an unstable monomorphic population of cooperators exists (i.e. D(1)<0), and case (v) if x* is CS but not ESS-stable (i.e. D′(x*)<0 and E(x*)>0) and a stable monomorphic population of cooperators exists (i.e. D(1)>0), where x* is the smallest singular strategy (D(x*) = 0 and 0<x*<1). In all cases, n = 5.

