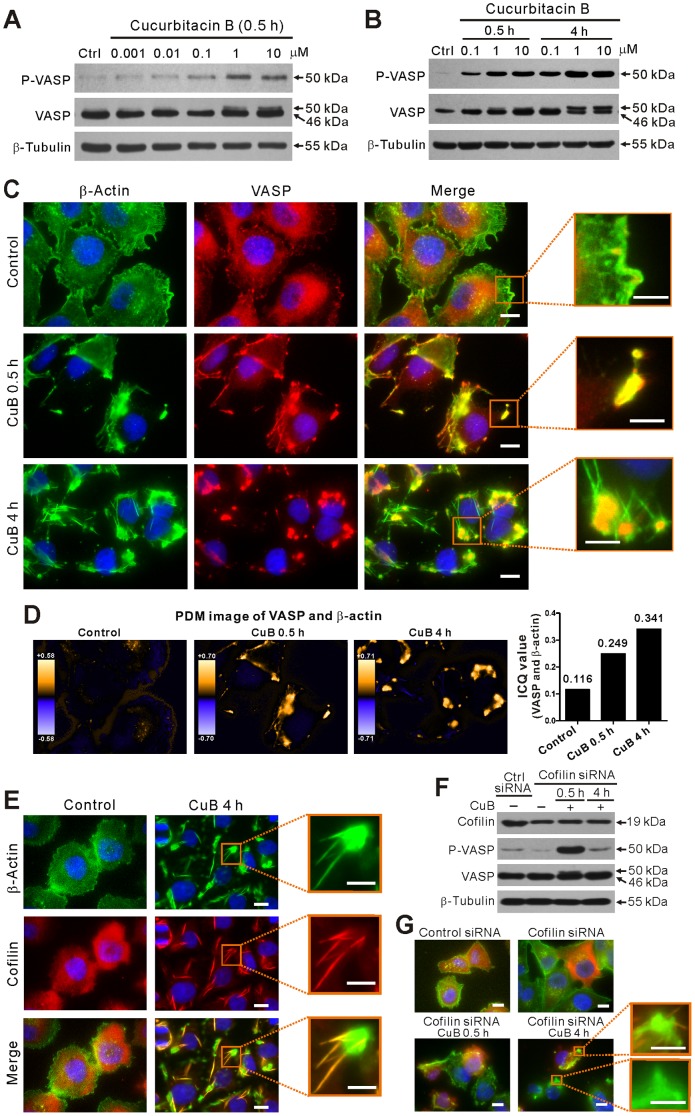
Figure 1. Cucurbitacin B (CuB) induced VASP phosphorylation and clustering in A375 cells.
(A,B) Western blot analysis showing the dose- (A) and time- (B) dependent effect of CuB on VASP phosphorylation. (C) Immunofluorescence microscopy analysis showing the co-localization (yellow) of VASP (red) and actin (green) with nuclei (blue) counter staining after 0.1 μM CuB treatment. (D) Co-localization analysis of VASP and actin of C. Both PDM images and ICQ values (right panel) are shown. (E) CuB induced cofilin-actin rod formation. Cells were immunostained with anti-β-actin (green) and anti-cofilin (red) antibodies with nuclei (blue) counter staining. (F) Influence of cofilin knockdown on CuB-induced VASP activation. (G) Influence of cofilin knockdown on actin distribution. Magnified images of the boxed areas (merged images) are presented in C, E and G. Scale bars: 10 μm (5 μm in magnified images).

