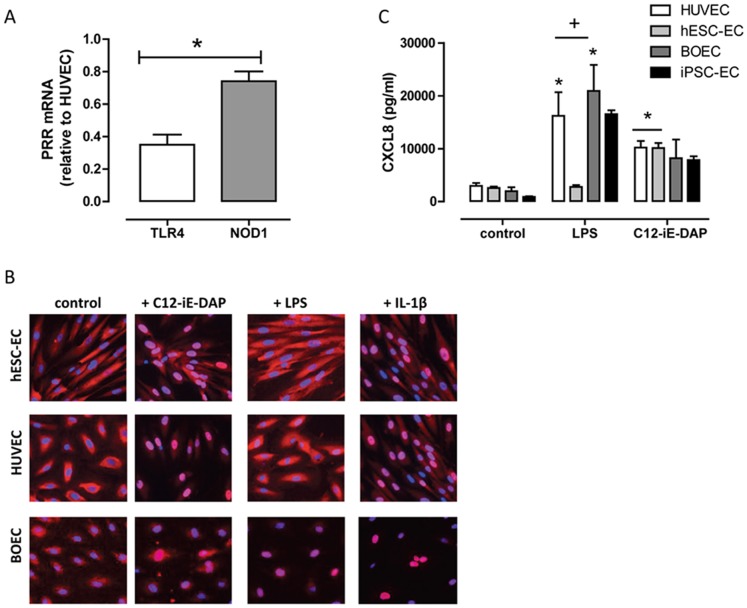
Figure 1. TLR4 and NOD1 expression and function in stem cell derived endothelial cells.
(A) TLR4 and NOD1 expression in hESC-EC (relative to expression in HUVEC) in vitro. Data are mean ± SEM (n = 3). Statistical significance was determined by one-sample t-test (*p<0.05) for NOD1 vs. TLR4 expression. (B) Representative immunocytochemistry images of hESC-EC (top) and HUVEC (bottom) stained for the NF-κB p65-subunit (red) in response to 1 hour treatment with or without, C12-iE-DAP (NOD1 agonist; 10 µg/ml), LPS (TLR4 agonist; 1 µg/ml) or IL-1β (1 ng/ml). Nuclei were stained with DAPI (blue; 5 µg/ml). Images were acquired using a Cellomics VTi HCS Arrayscanner with a CarlZeiss microscope. (C) LPS (TLR4 agonist; 1 µg/ml) and C12-iE-DAP (NOD1 agonist; 10 µg/ml) induced CXCL8 release after 24 hour stimulation. Data are mean ± SEM. For HUVEC, hESC-EC or BOEC, n = 4–8. For iPSC-EC, n = 2, single isolation. Statistical significance was determined by one-way ANOVA followed by Dunnett's multiple comparison test for each cell type (*p<0.05) and by two-way ANOVA followed by Bonferroni's post-test for between cell types. Analysis was not performed on data from iPSC-EC.

