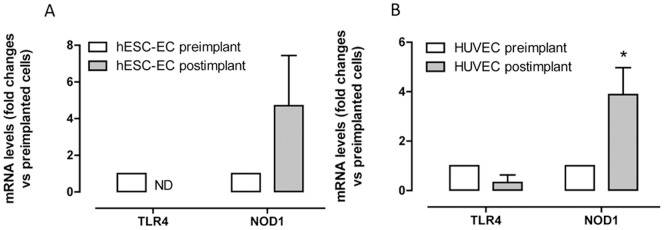
Figure 2. Effect of in vivo ‘conditioning’ on TLR4 and NOD1 expression.

TLR4 and NOD1 expression in (A) hESC-EC and (B) HUVEC before (pre-implant; open bars) and 21 days after (post-implant; filled bars) implantation in vivo (‘conditioning’). Data are mean ± SEM and are normalized at unity (1) to gene levels in pre-implant cells. HUVEC; NOD1 pre-implant n = 8, post implant n = 4: HUVEC; TLR4 pre-implant n = 10, post implant n = 3. hESC-ECs; NOD1 pre-implant n = 6, post implant n = 5: hESC-ECs; TLR4 pre-implant n = 10, post implant n = 6. Data was obtained from 2 independent experiments (using up to 12 rats per group). Statistical significance was determined by one-sample t-test where results were compared to a theoretical control of 1 (*p<0.05). ND = none detectable.
