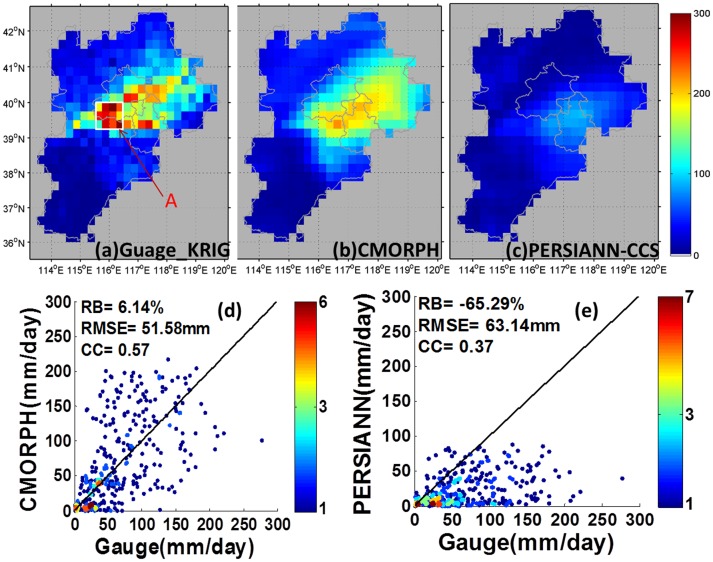
Figure 2. Gauge analysis (a) based on Kriging interpolation.
(b) CMORPH accumulated precipitation (c) PERSIANN-CCS accumulated precipitation. (d) Scatter plots of gauge vs. CMORPH accumulated rainfall. (e) Scatter plot of gauge vs. PERSIANN-CCS accumulated rainfall. The red letter “A” in (a) indicates the rainfall center.

