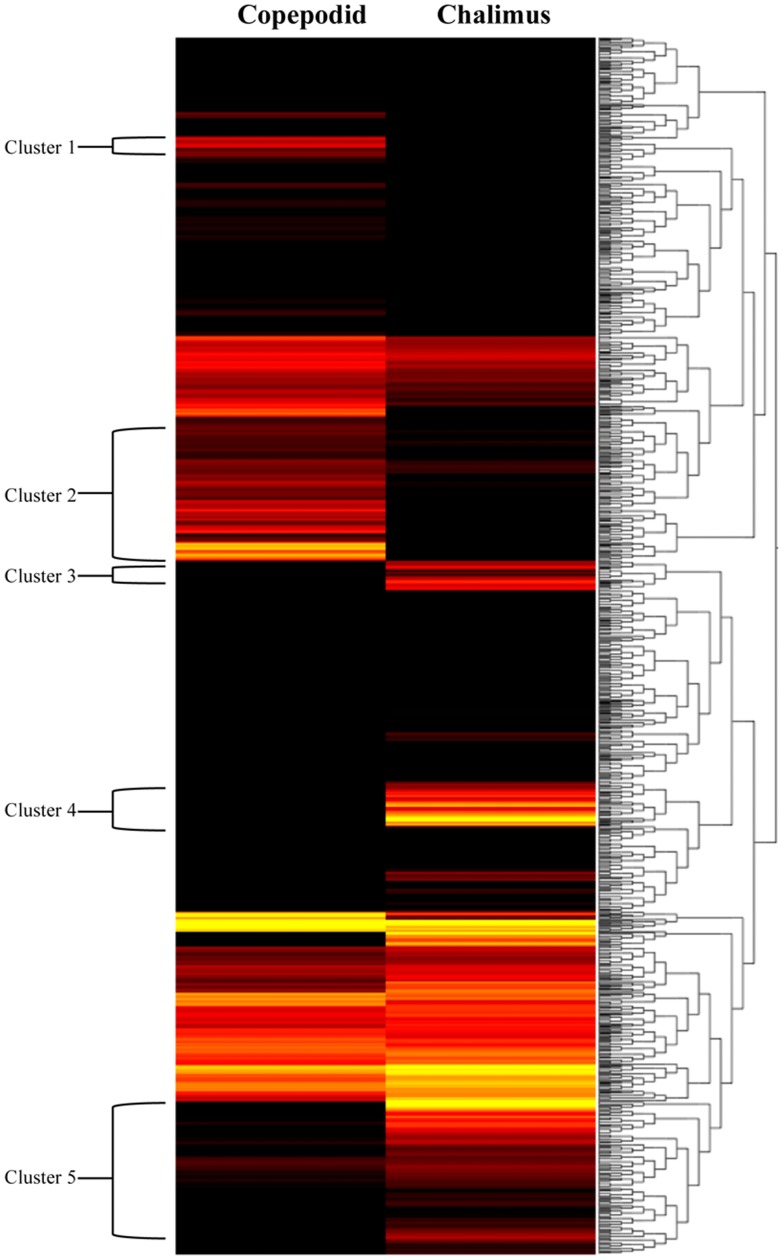
Figure 5. Clusters of gene expression levels between copepodid and chalimus stages of C. rogercresseyi.
Dendrograms of the transcription patterns were estimated for 83,444 contigs generated by de novo assembling. The bar color reflects the gene expression level from black (low), red (medium) to yellow (high). Contig annotations of these 5 clusters are listed in Table S3.

