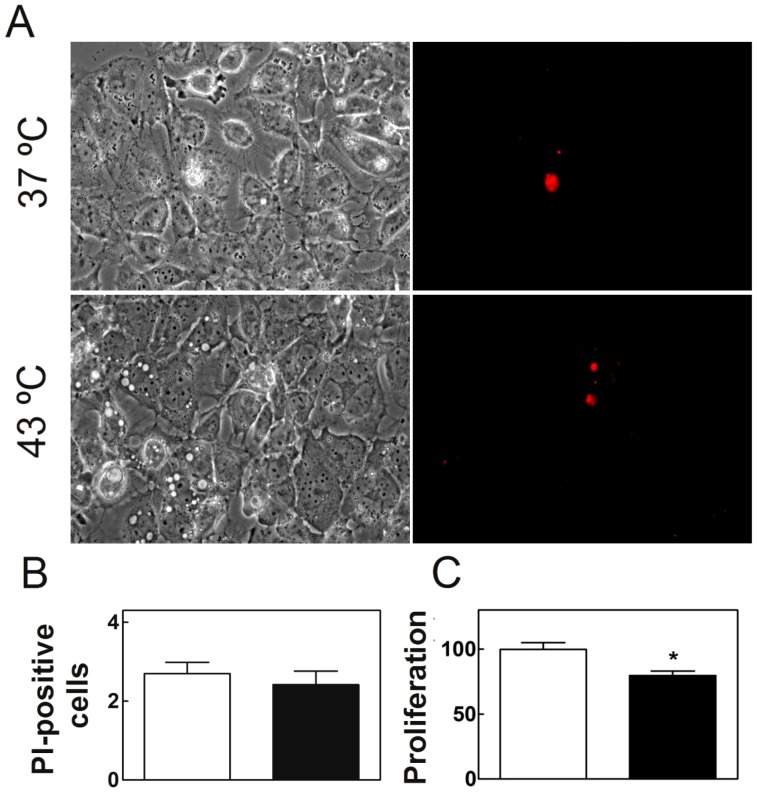
Figure 3. Effects of hyperthermia on SC viability.
Cells cultured at 37°C and cells cultured similarly at 37°C but exposed once a day for 15 min to 43°C, both during five days, are compared. A) Phase contrast (left) and fluorescence images (right) of propidium iodide (PI)-positive TM4 cell nuclei. B) Quantification of dead cells after control (white bars) and hyperthermia treatments (black bars), as reported by the labeling with PI (% of dead cells with respect to total cells in each condition). C) Viability of the cells, as evaluated by their capacity to reduce the MTT reagent (% of live cells in each condition) (*p<0.05).

