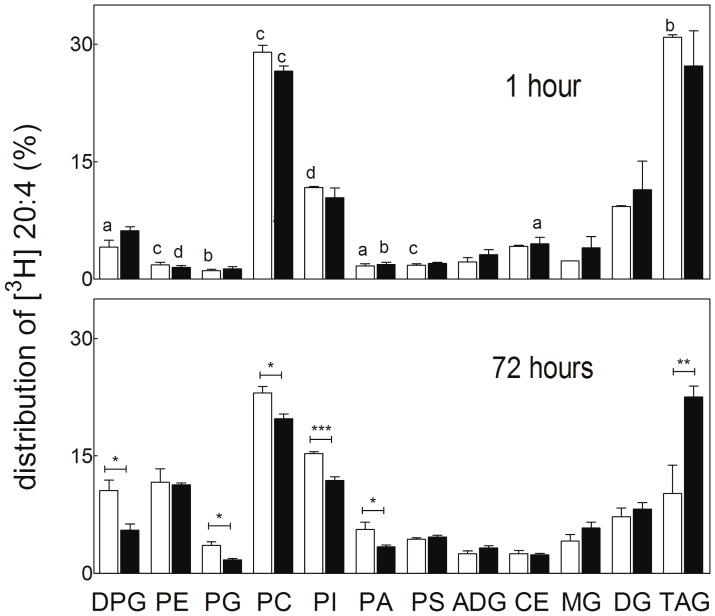
Figure 5. Effects of hyperthermia on the distribution (%) of [3H] arachidonic acid (AA) among TM4 cell lipids.
Control cells cultured for 5 days at 37°C (white bars) and cells similarly cultured but exposed once a day for 15 min to 43°C (black bars) are compared. After these exposures, the cells were incubated for 1 hour with [3H] AA. The medium was removed, the cells were washed, and samples were immediately obtained (indicated as 1 hour) for lipid analysis. The rest of the washed cells were cultured for a further period of 3 days (indicated as 72 hours), in both cases at 37°C, lipids being obtained at the end of this period. Statistically significant differences associated to incubation time (1 hour versus 72 hours) at each temperature condition, are indicated by letters. Differences associated to temperature conditions (previous exposures to 37°C versus 43°C) at each incubation time are indicated with asterisks (*p<0.01; **p<0.008; ***p<0.0005; (a) p<0.030; (b) p<0.008; (c) p<0.005; (d) p<0.0001).

