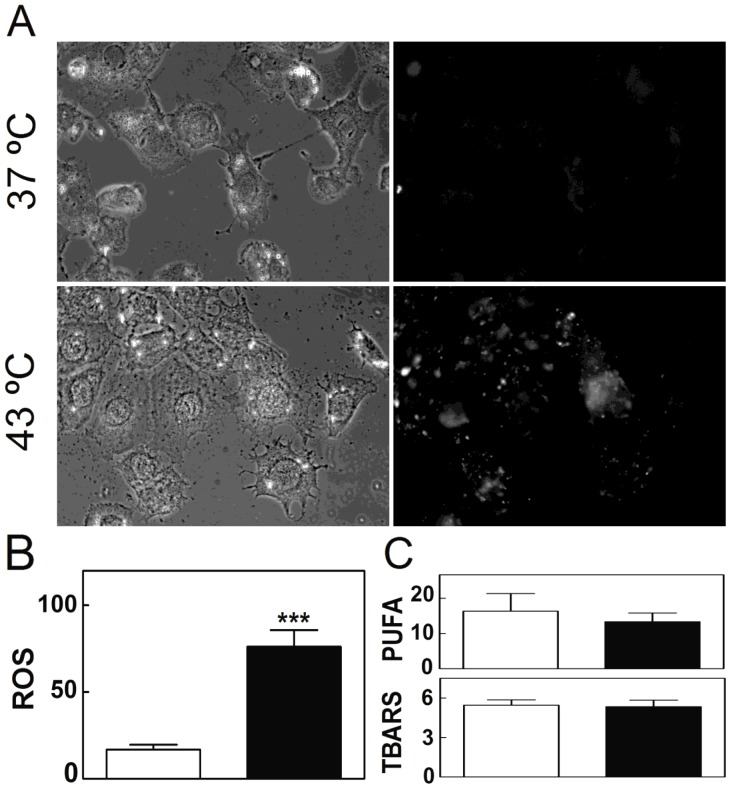
Figure 7. Effects of hyperthermia on SC oxidative stress.
Cells cultured for 5 days at 37°C and cells cultured similarly but exposed once a day for 15 min to 43°C, are compared. A) Phase contrast (left) and fluorescence (right) images of TM4 cells treated with the probe DCDCDHF to monitor the oxidative status. B) Reactive oxigen species (ROS), as quantified from the average intensity of the fluorescent emission per cell in control (white bars) and experimental (black bars) conditions. Results are expressed on the same basis, as arbitrary units (*p<0.03; ***p<0.0001). C) Upper panel: percentage of long-chain PUFA in the total lipid of cells; lower panel: absorbance of TBA reactive substances (TBARS), produced by cells exposed to the same conditions.

